 Mon GéoSource
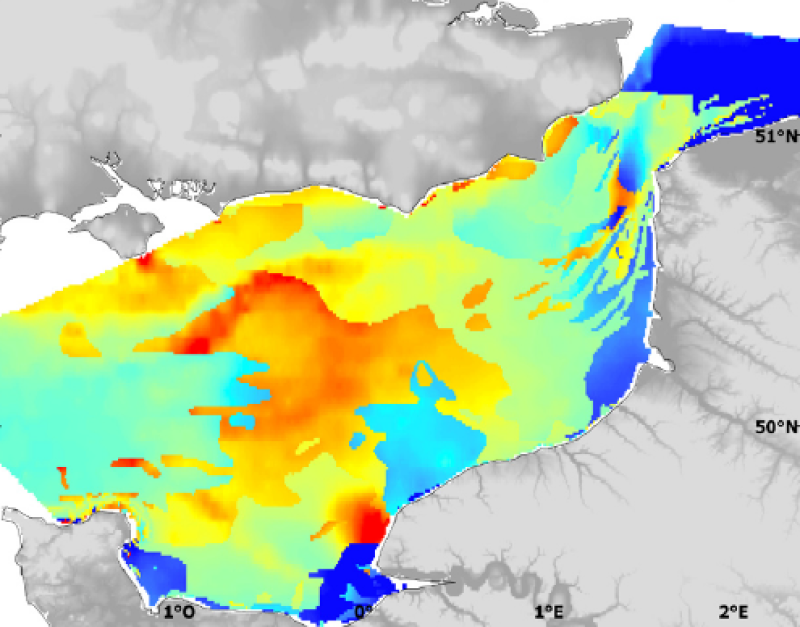
Species and habitats - Scyliorhinus canicula - All ages Female - Potential habitat in October modelled by Quantile Regression and its uncertainty with CGFS data
Modelised abundance of species or prediction uncertainty.
Simple
- Alternate title
- CGFS_species_model
- Date ( Publication )
- 2009-12-31T00:00:00
- Identifier
- CHARM_SCYOCAN_F_CGFS_RQ_MOD_ERR_R
- Presentation form
- Digital map
- Other citation details
- Source CHARM Consortium
- Credit
- CEFAS
- Credit
- CHARM consortium
- Status
- Completed
- Maintenance and update frequency
- As needed
- Thèmes Sextant ( Theme )
-
- /Biological Environment/Species/Fish Species of Commercial Interest
- Keywords ( Discipline )
-
- Species data set
- CHARM
- GEMET - INSPIRE themes, version 1.0 ( Theme )
-
- Répartition des espèces
- external.theme.gemet ( Theme )
-
- ressource halieutique
- Use limitation
- research-only
- Access constraints
- License
- Other constraints
- Has to be cited this way in maps : "Source CHARM Consortium"
- Other constraints
- Has to be cited this way in bibliography : "Carpentier A, Martin CS, Vaz S (Eds.), 2009. Channel Habitat Atlas for marine Resource Management, final report / Atlas des habitats des ressources marines de la Manche orientale, rapport final (CHARM phase II). INTERREG 3a Programme, IFREMER, Boulogne-sur-mer, France. 626 pp. & CD-rom"
- Spatial representation type
- Grid
- Denominator
- 2500
- Metadata language
- fr
- Metadata language
- en
- Character set
- UTF8
- Topic category
-
- Oceans
- Biota
- Environment
- Environment description
- Microsoft Windows XP ; ESRI ArcGIS 9.x
- Geographic identifier
- Eastern English Channel
N
S
E
W
))
- Reference system identifier
- WGS 84 (EPSG:4326)
- Number of dimensions
- 2
- Dimension name
- Column
- Dimension size
- 489
- Resolution
- 0.009 degree
- Dimension name
- Row
- Dimension size
- 278
- Resolution
- 0.009 degree
- Cell geometry
- Area
- Transformation parameter availability
- No
Distributor
- OnLine resource
-
CHARM web site
(
WWW:LINK
)
CHARM web site
- OnLine resource
-
CHARM_SCYOCAN_F_CGFS_RQ_R
(
OGC:WMS
)
Potential habitat
- OnLine resource
-
CHARM_SCYOCAN_F_CGFS_RQ_MOD_ERR_R
(
OGC:WMS
)
Model error
- Protocol
- COPYFILE
- Name
- Potential habitat
- Description
- Potential habitat
- Protocol
- COPYFILE
- Name
- Model error
- Description
- Model error
- Hierarchy level
- Dataset
- Statement
- In short, models based on GLMs predict the mean response of the species to environmental factors whilst models based on RQ predict the maximal response. When GLM uses abundance data, the preferential habitat is predicted, whilst the probable habitat is predicted when GLM uses binary presence-absence data. Generalised Linear Modelling (GLM) describes and predicts the "preferential habitat", i.e. the portion of the potential habitat that is used on average over time, or, in the case of presence-absence species data, the "probable habitat", i.e. where the species may be present. RQ tends to describe potential spatial patterns or the "potential habitat" of species, i.e. all possible areas with conditions suitable for the presence or high abundance levels of a species.
- Description
- Quantile Regression (RQ) belongs to the family of regression approaches that also includes simple li-near and multiple regression (Koenker, 2005). In RQ, any part of the data distribution may be modelled rather than the mean (a quantile q describing the value greater or equal to q% of the observed data, or in other words the upper bound of q% of the observed data). The study of the upper-bound of response data (typically abundance between 0.75 and 0.95 quantiles) as a function of environmental factor (figure 3) allows estimating their limiting effects on a species distribution (Cade et al., 1999; Hiddink & Kaiser, 2005). As for GLM modelling (see §4.1), the selected environment predictors were: temperature, salinity, bed shear stress, depth, chlorophyll a concentration (only for the egg stage) and fluorescence (only for the larval stage) as continuous covariables and seabed sediment type as factor. Model selection with RQ is made complicated by the large number of candidate models that can be estimated over a range of different quantiles (i.e. one model per quantile): in other words, the model selection includes both the selection of explanatory variables and that of the quantile at which there are considered. Model selection was carried out by initially fitting a model to all available explanatory variables (continuous parameters were introduced as second order polynomials, nominal variables as factors and all first order interactions between environmental parameters were considered; note that interactions were not tested for the egg stage). The selection procedure used is that proposed by Vaz et al. (2008). RQ models were estimated at five quantile intervals, from the 75th to the 95th. Using a backwards elimination procedure, significance tests of all polynomials and interactions were performed and the variable associated with the largest average p-value across the five quantiles, contingent on being greater than 0.05, was selected to be removed from the model. The reduced model hence obtained was then re-run across all five quantiles, and additional variables were removed according to the same rule. Main effects were tested only when associated interactions and second order polynomials had been eliminated. The process of backward elimination was stopped when all remaining variables were significant (p < 0.05) at least for one quantile (Vaz et al., 2008), this quantile being selected as the representative quantile. In case the resulting model was found to have all variables significant over more than one quantile, the highest of these quantiles was chosen, as the more representative of the limiting effect imposed by the environmental variables over the species abundance. For each species considered, the equation of the final habitat model was used to recode digital maps of the environmental factors with the predicted abundance (or presence probability) of the species, using the Raster Calculator tool, thereby producing a habitat map. Prior to this and for each survey, digital (raster) maps of the environmental parameters had been limited to the ranges of values observed during the surveys, so as to avoid extrapolating outside the model development bounds. The resulting habitat maps were further centred and standardised, so that the resulting maps ranged between 0 and 1, thereby permitting an easier comparison amongst results from different stage, species or season (notable exceptions are the habitat maps based on binary data, and the larval stage habitat maps). The spatial distribution of the model error ratios was mapped for each model, the value of 1 corresponding to the maximum possible prediction error. The model prediction error can thus be interpreted as a percentage of model uncertainty.
- Description
- CGFS, annual scientific survey of IFREMER
- File identifier
- 85b8d32c-aacf-49fd-874a-036765a68990 XML
- Metadata language
- en
- Character set
- UTF8
- Hierarchy level
- Dataset
- Date stamp
- 2020-06-04T00:36:03
- Metadata standard name
- ISO 19115:2003/19139 - SEXTANT
- Metadata standard version
- 1.0
Overviews
Spatial extent
N
S
E
W
Provided by

Associated resources
Not available