 Mon GéoSource
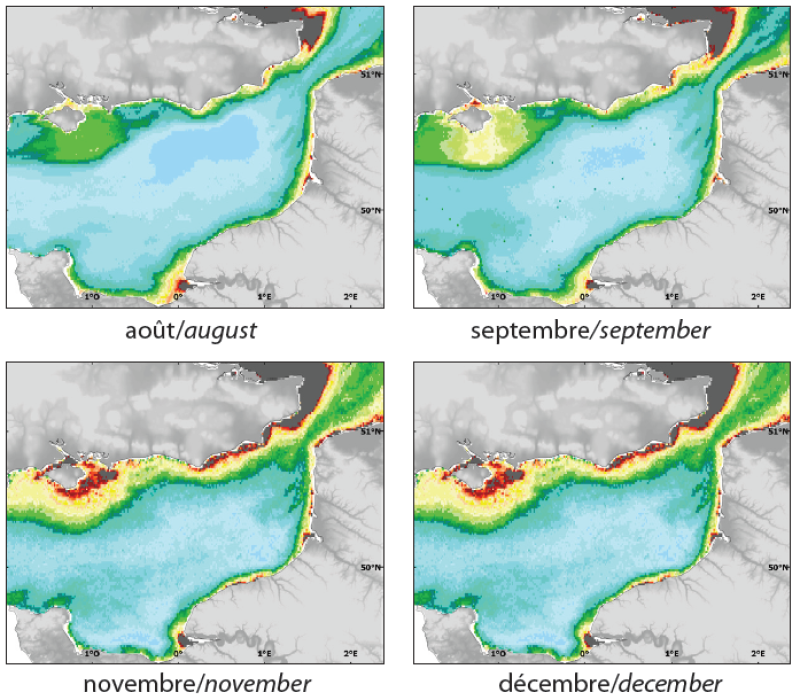
Physical environment - Modelled satellite data - Mean monthly attenuation coefficient of Photosynthetically Available Radiation (KPAR) (1998-2006)
Simple
- Alternate title
- Satellite_environment_geostatP
- Date ( Publication )
- 2009-12-31T00:00:00
- Identifier
- CHARM_SATELL_KPAR_12_R
- Presentation form
- Digital map
- Other citation details
- Source CHARM Consortium
- Credit
- CERSAT
- Credit
- CHARM consortium
- Status
- Completed
- Maintenance and update frequency
- As needed
- Thèmes Sextant ( Theme )
-
- /Physical Environment/Physical Habitats
- Keywords ( Discipline )
-
- environment data set
- CHARM
- external.theme.gemet ( Theme )
-
- mesure d'atténuation
- GEMET - INSPIRE themes, version 1.0 ( Theme )
-
- Oceanographic geographical features
- Use limitation
- research-only
- Access constraints
- License
- Other constraints
- Has to be cited this way in maps : "Source CHARM Consortium"
- Spatial representation type
- Grid
- Denominator
- 1000
- Metadata language
- fr
- Metadata language
- en
- Character set
- UTF8
- Topic category
-
- Oceans
- Environment description
- Microsoft Windows XP ; ESRI ArcGIS 9.x
- Geographic identifier
- Eastern English Channel
))
- Begin date
- 1998-01-01T00:00:00
- End date
- 2006-12-31
- Reference system identifier
- WGS 84 (EPSG:4326)
- Number of dimensions
- 2
- Dimension name
- Column
- Dimension size
- 141
- Resolution
- 0.015 degree
- Dimension name
- Row
- Dimension size
- 84
- Resolution
- 0.015 degree
- Cell geometry
- Area
- Transformation parameter availability
- No
Distributor
- OnLine resource
-
CHARM web site
(
WWW:LINK
)
CHARM web site
- Protocol
- COPYFILE
- Name
- January
- Description
- January
- Protocol
- COPYFILE
- Name
- February
- Description
- February
- Protocol
- COPYFILE
- Name
- March
- Description
- March
- Protocol
- COPYFILE
- Name
- April
- Description
- April
- Protocol
- COPYFILE
- Name
- May
- Description
- May
- Protocol
- COPYFILE
- Name
- June
- Description
- June
- Protocol
- COPYFILE
- Name
- July
- Description
- July
- Protocol
- COPYFILE
- Name
- August
- Description
- August
- Protocol
- COPYFILE
- Name
- September
- Description
- September
- Protocol
- COPYFILE
- Name
- October
- Description
- October
- Protocol
- COPYFILE
- Name
- November
- Description
- November
- Protocol
- COPYFILE
- Name
- December
- Description
- December
- OnLine resource
-
CHARM_SATELL_KPAR_01_R
(
OGC:WMS
)
January
- OnLine resource
-
CHARM_SATELL_KPAR_02_R
(
OGC:WMS
)
February
- OnLine resource
-
CHARM_SATELL_KPAR_03_R
(
OGC:WMS
)
March
- OnLine resource
-
CHARM_SATELL_KPAR_04_R
(
OGC:WMS
)
April
- OnLine resource
-
CHARM_SATELL_KPAR_05_R
(
OGC:WMS
)
May
- OnLine resource
-
CHARM_SATELL_KPAR_06_R
(
OGC:WMS
)
June
- OnLine resource
-
CHARM_SATELL_KPAR_07_R
(
OGC:WMS
)
July
- OnLine resource
-
CHARM_SATELL_KPAR_08_R
(
OGC:WMS
)
August
- OnLine resource
-
CHARM_SATELL_KPAR_09_R
(
OGC:WMS
)
September
- OnLine resource
-
CHARM_SATELL_KPAR_10_R
(
OGC:WMS
)
October
- OnLine resource
-
CHARM_SATELL_KPAR_11_R
(
OGC:WMS
)
November
- OnLine resource
-
CHARM_SATELL_KPAR_12_R
(
OGC:WMS
)
December
- Hierarchy level
- Dataset
- Statement
- Images (provided as rasters, 1.2 km cell size, referenced in WGS 1984) were obtained from IFREMER’s CERSAT (located in Plouzané, France) from databases generated for European projects (e.g. MARCOAST, ECOOP). Original data come from the AVHRR/Pathfinder centre (AVHRR sensor) and from NASA (SeaWiFS and MODIS). The best images, i.e. those where the percentage of cloud-free pixels was above a threshold of 25%, were used to calculate monthly averages.
- Description
- The mean was calculated on a Mercator grid (733 columns by 657 lines) with a pixel size of 1.2 km. For each pixel of the grid, the mean value is simply the arithmetic mean of all the satellite-derived SST, chlorophyll a concentration, mineral SPM, turbidity indicator or KPAR recorded during the month considered /SST for the period 1986-2006 ; chlorophyll a concentration, mineral SPM and KPAR for the period 1998-2006/ The first step consists in assessing the physical value of interest by applying geometric and atmospheric corrections onto the measurements taken by the sensor on-board the satellite. Climatologies can then be produced using the data. (1) SST is calculated using the infra-red channels of the AVHRR sensor on-board NOAA satellite platforms. Since 1986, thanks to these data, twice-daily temporal series for SST have been built. The SST calculation algorithm is described in Walton et al., 1998. The coefficients are calculated by regression using in situ data. (2) Ocean colour data derived from SeaWiFS and MODIS sensor allow for the assessment of chlorophyll a concentration. These assessments are based on sea water radiance measurements (Gohin et al., 2002, 2005). To retrieve chlorophyll a concentration from the radiance, a look-up table on in situ measurements and on the blue/green radiance ratio is used (procedure described in Gohin et al., 2002). (3) Once chlorophyll a concentration has been determined mineral SPM is derived from the radiance measured in the green, at 555 nm, and the red, at 670 nm.Mineral SPM is estimated by reversing a semi-analytic model of the radiation transfer taking into account the theoretical absorption and diffusion coefficients of the water and its components (algorithm based on the method of Gohin et al., 2005. This method provides realistic estimations on the continental shelf). (4) KPAR is calculated using a linear relationship, which uses mineral SPM and chlorophyll a concentration (see Gohin et al., 2005 for details).
- Description
- AVHRR/NOAA for SST; SeaWiFS and MODIS for chlorophyll a, mineral SPM, turbidity indicator and attenuation coefficient.
- File identifier
- f2f1595c-b23b-4112-b330-bf7608d62eae XML
- Metadata language
- en
- Character set
- UTF8
- Hierarchy level
- Dataset
- Date stamp
- 2020-06-04T00:26:09
- Metadata standard name
- ISO 19115:2003/19139 - SEXTANT
- Metadata standard version
- 1.0
Overviews
Spatial extent
Provided by
