 Mon GéoSource
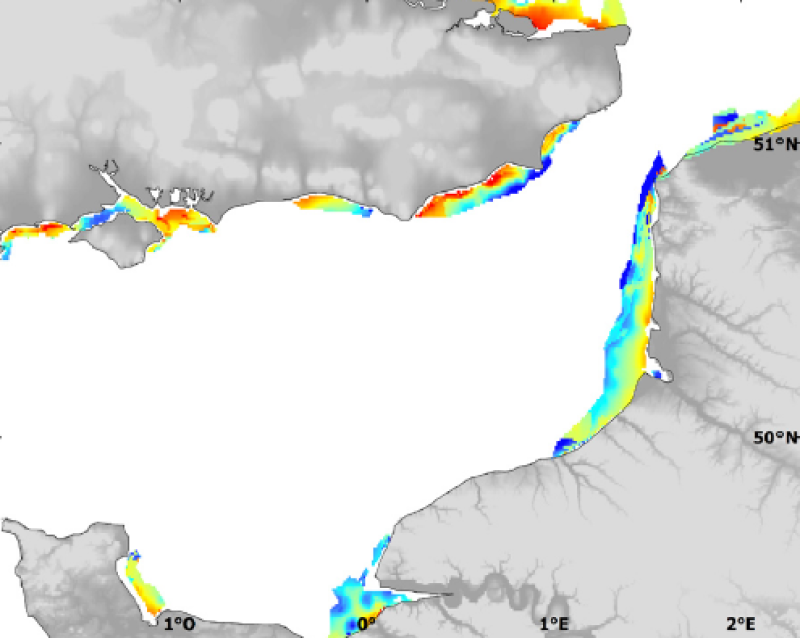
Species and habitats - Pleuronectes platessa - Nurseries - Preferential habitat modellised by Generalised Linear Modelling and its uncertainty for YFS survey
Modelised abundances of several species in coastal nurseries or prediction uncertainty.
Simple
- Autres appellations ou acronymes
- YFS_species_model
- Date ( Publication )
- 2009-12-31T00:00:00
- Identificateur
- CHARM_PLEUPLA_NURS_GLM_MOD_ERR_R
- Forme de la présentation
- Carte numérique
- Autres informations de référence
- Source CHARM Consortium
- Reconnaissance
- IFREMER / CEFAS
- Reconnaissance
- CHARM consortium
- Etat
- Finalisé
- Fréquence de mise à jour
- Lorsque nécessaire
- Thèmes Sextant Thèmes Sextant ( Thème )
-
- /Milieu biologique/Espèces/Espèces d'intérêt halieutique
- Mots clés ( Discipline )
-
- espèces
- CHARM
- GEMET - INSPIRE themes, version 1.0 GEMET - INSPIRE themes, version 1.0 ( Thème )
-
- Habitats et biotopes
- external.theme.gemet external.theme.gemet ( Thème )
-
- ressource halieutique
- Mots clés ( Thème )
-
- zone fonctionnelle halieutique
- Limitation d'utilisation
- research-only
- Contraintes d'accès
- Licence
- Autres contraintes
- Has to be cited this way in maps : "Source CHARM Consortium"
- Autres contraintes
- Has to be cited this way in bibliography : "Carpentier A, Martin CS, Vaz S (Eds.), 2009. Channel Habitat Atlas for marine Resource Management, final report / Atlas des habitats des ressources marines de la Manche orientale, rapport final (CHARM phase II). INTERREG 3a Programme, IFREMER, Boulogne-sur-mer, France. 626 pp. & CD-rom"
- Type de représentation spatiale
- Raster
- Dénominateur de l'échelle
- 2500
- Langue
- fr
- Langue
- en
- Jeu de caractères
- Utf8
- Catégorie ISO
-
- Biote
- Description de l'environnement de travail
- Microsoft Windows XP ; ESRI ArcGIS 9.x
- Identifiant géographique
- Eastern English Channel
N
S
E
W
))
- Date de début
- 1977-01-01
- Date de fin
- 2006-12-31
- Nom du système de référence
- WGS 84 (EPSG:4326)
- Dimensions
- 2
- Noms des axes
- Axe - X
- Nombre de pixel
- 489
- Résolution
- 0.009 degree
- Noms des axes
- Axe - Y
- Nombre de pixel
- 278
- Résolution
- 0.009 degree
- Type de raster
- Surface
- Disponibilité des paramètres de transformation
- Non
Distributeur
- Ressource en ligne
-
CHARM_PLEUPLA_NURS_GLM_R
(
OGC:WMS
)
Preferential habitat
- Ressource en ligne
-
CHARM_PLEUPLA_NURS_GLM_MOD_ERR_R
(
OGC:WMS
)
Model error
- Ressource en ligne
-
CHARM web site
(
WWW:LINK
)
CHARM web site
- Protocole
- COPYFILE
- Nom
- Preferential habitat
- Description
- Preferential habitat
- Protocole
- COPYFILE
- Nom
- Model error
- Description
- Model error
- Niveau
- Jeu de données
- Généralités sur la provenance
- Combinations of the French YFS and the British YFS.
- Description
- GLM describes the mean response of a species abundance or presence probability according to environmental conditions (figure 2). In this type of model, a linear prediction is related to the mean of the response variable through a link function (e.g. identity function for a normally distributed variable, or logit function for binary data). Corresponding habitat models required a two step modelling procedure. The presence probability of the considered species as a function of environmental factors is first modelled using presence-absence data, independently from abundance data. Then, the response in terms of abundance is modelled in case of presence only. The species¿ habitat can finally be predicted by combining the presence-absence model with the model of abundance response in case of presence. This procedure allows circumventing the problem of atypical distribution of count data which include numerous observations with value zero, which is common in species abundance data (Stefánsson, 1996; Barry & Welsh, 2002). In this study, model selection was carried out by initially fitting a complete model including all available explanatory variables (continuous parameters were introduced as second order polynomials, nominal variables as factors and all first order interactions between environmental parameters were considered; note that interactions were not tested for the egg developmental stage). The selected environment predictors were: temperature, salinity, bed shear stress, depth, chlorophyll a concentration (only for the egg stage), fluorescence (only for the larval stage) and seabed sediment type. Although the first six factors were regarded as continuous covariables, sediment type (mud, fine sand, coarse sand, gravel and pebble) was introduced in the model as a categorical factor. The GLM model was optimised through backward selection based on Chi-square or F-test significance tests (Venables & Ripley, 2002). This approach was taken rather than Akaike Information Criterion reduction (or AIC; Akaike, 1974) to be coherent with quantile regression selection procedure which is also based on significance tests. For presence-absence data, binomial modelling with logit link function was chosen to obtain a prediction of the probability of presence of the species considered. For non-null abundance data (i.e. removing zero values), the data was log-transformed to achieve normality, and gaussian modelling with identity link function was used to predict positive density on a log scale. The predicted probability of presence was then multiplied with the positive density prediction, to obtain the final predicted value of abundance (Stefánsson, 1996). For each species considered, the equation of the final habitat model was used to recode digital maps of the environmental factors with the predicted abundance (or presence probability) of the species, using the Raster Calculator tool, thereby producing a habitat map. Prior to this and for each survey, digital (raster) maps of the environmental parameters had been limited to the ranges of values observed during the surveys, so as to avoid extrapolating outside the model development bounds. The resulting habitat maps were further centred and standardised, so that the resulting maps ranged between 0 and 1, thereby permitting an easier comparison amongst results from different stage, species or season (notable exceptions are the habitat maps based on binary data, and the larval stage habitat maps). The spatial distribution of the model error ratios was mapped for each model, the value of 1 corresponding to the maximum possible prediction error. The model prediction error can thus be interpreted as a percentage of model uncertainty.
- Description
- FYFS plus BYFS surveys
- Identifiant de la fiche
- b78421b9-1b20-49fe-84b1-cbf0d599efe7 XML
- Langue
- en
- Jeu de caractères
- Utf8
- Type de ressource
- Jeu de données
- Date des métadonnées
- 2020-06-04T00:51:46
- Nom du standard de métadonnées
- ISO 19115:2003/19139 - SEXTANT
- Version du standard de métadonnées
- 1.0
Aperçus
Étendue spatiale
N
S
E
W
Fourni par

Ressources associées
Not available