 Mon GéoSource
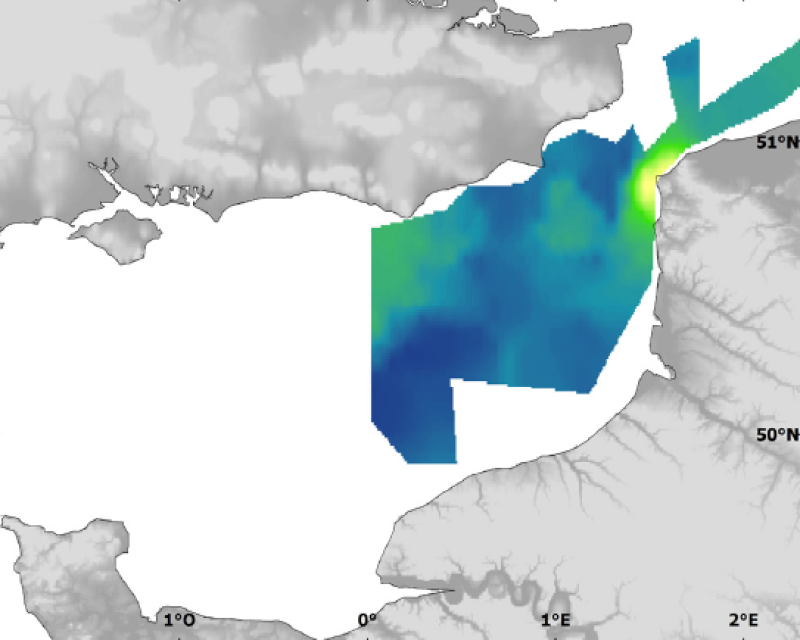
Physical environment - In situ data - Chlorophyll a concentration collected during the International Bottom Trawl Survey in 2007
Three environmental parameters were measured in situ during the IBTS in 2007. Temperature and salinity were measured using thermosalinometer 3 to 5 m under sea surface. Sub-surface (3-5 m) chlorophyll a concentration was measured using a fluorometer (measure the fluorescence emitted by the pigment). The IBTS survey, which takes place each year in January, gives a good illustration of winter conditions.
Simple
- Alternate title
- IBTS_environment_geostatA
- Date ( Publication )
- 2009-12-31T00:00:00
- Identifier
- CHARM_IBTS_CHLOROA_R
- Presentation form
- Digital map
- Other citation details
- Source CHARM Consortium
- Credit
- IFREMER
- Credit
- CHARM consortium
- Status
- Completed
Point of contact
Ifremer
-
Yves Verin
(
)
Laboratoire de Ressources Halieutiques, Ifremer, 150 quai Gambetta BP699
,
Boulogne sur mer
,
62321
,
- Maintenance and update frequency
- As needed
- Thèmes Sextant ( Theme )
-
- /Physical Environment/Physical Habitats
- Keywords ( Discipline )
-
- Species data set
- CHARM
- external.theme.gemet ( Theme )
-
- ressource halieutique
- GEMET - INSPIRE themes, version 1.0 ( Theme )
-
- Oceanographic geographical features
- Use limitation
- research-only
- Access constraints
- License
- Other constraints
- Has to be cited this way in maps : "Source CHARM Consortium"
- Other constraints
- Has to be cited this way in bibliography : "Carpentier A, Martin CS, Vaz S (Eds.), 2009. Channel Habitat Atlas for marine Resource Management, final report / Atlas des habitats des ressources marines de la Manche orientale, rapport final (CHARM phase II). INTERREG 3a Programme, IFREMER, Boulogne-sur-mer, France. 626 pp. & CD-rom"
- Spatial representation type
- Grid
- Denominator
- 1000
- Metadata language
- en
- Metadata language
- fr
- Character set
- UTF8
- Topic category
-
- Biota
- Oceans
- Environment
- Environment description
- Microsoft Windows XP ; ESRI ArcGIS 9.x
- Geographic identifier
- Dover strait and southern half of the North Sea
N
S
E
W
))
- Begin date
- 2007-01-01T16:09:00
- End date
- 2007-01-31T09:00:00
- Reference system identifier
- 4326
- Reference system identifier
- EPSG / WGS 84 (EPSG:4326) / 7.4
- Number of dimensions
- 2
- Dimension name
- Column
- Dimension size
- 334
- Resolution
- 0.009 degree,
- Dimension name
- Row
- Dimension size
- 314
- Resolution
- 0.009 degree,
- Cell geometry
- Area
- Transformation parameter availability
- No
Distributor
- OnLine resource
-
CHARM web site
(
WWW:LINK
)
CHARM web site
- Protocol
- COPYFILE
- Name
- Chlorophyll a concentration
- Description
- Chlorophyll a concentration
- OnLine resource
-
CHARM_IBTS_CHLOROA_R
(
OGC:WMS
)
Chlorophyll a concentration
- Hierarchy level
- Dataset
- Statement
- The survey concerns the Dover Strait to the southern half of the North Sea. Its aim is to estimate fish abundance and distribution and to compute recruitment indices (abundance of juveniles) for the fish species exploited in the North Sea. In parallel to its regular actions, the 2007 French IBTS used a continuous fish egg pumping device called CUFES allowing the collection of information on the spatial distribution of winter spawning areas and on the spawning habitat of several important species.
- Description
- Statistical analysis : the statistical distribution of environmental data were tested for normality (histograms, skewness, kurtosis). The data were transformed whem skewness value exceeded |1| and/or kurtosis exceeded 1 and if a normalising function that could improve the data distribution was found. Environmental variables were measured on scales based on analytical conventions that are unrelated to the natural processes generated them. Therefore, any transformed scale is as appropriate as those on which these data were originally recorded. Geostatistical interpolation : the spatial variation of environmental data were analysed using GENSTAT (GENSTAT 7 Committee, 2004), which is a GENeral STATistics package including the main geostatistical tools. It computes experimental variograms, fits these with various authorised mathematical models and uses them to calculate kriged estimates on a fine regular grid (of latitudes and longitudes). The grid of points was imported into ArcMap and interpolated with the Spatial Analyst extension in order to create a continuous raster of 1 km² resolution. The resulting maps illustrate the spatial distributions and the variations over time for environmental data studied in CHARM's area. For legends of maps, approximates od the 5th and the 95th quantiles were used for the minimales and maximales values respectively.
- Description
- IBTS survey, scientific survey of IFREMER
- File identifier
- b818ec63-d11f-4b2f-833a-4037830e31a1 XML
- Metadata language
- en
- Character set
- UTF8
- Hierarchy level
- Dataset
- Date stamp
- 2020-06-04T00:40:07
- Metadata standard name
- ISO 19115:2003/19139 - SEXTANT
- Metadata standard version
- 1.0
Overviews
Spatial extent
N
S
E
W
Provided by

Associated resources
Not available