 Mon GéoSource
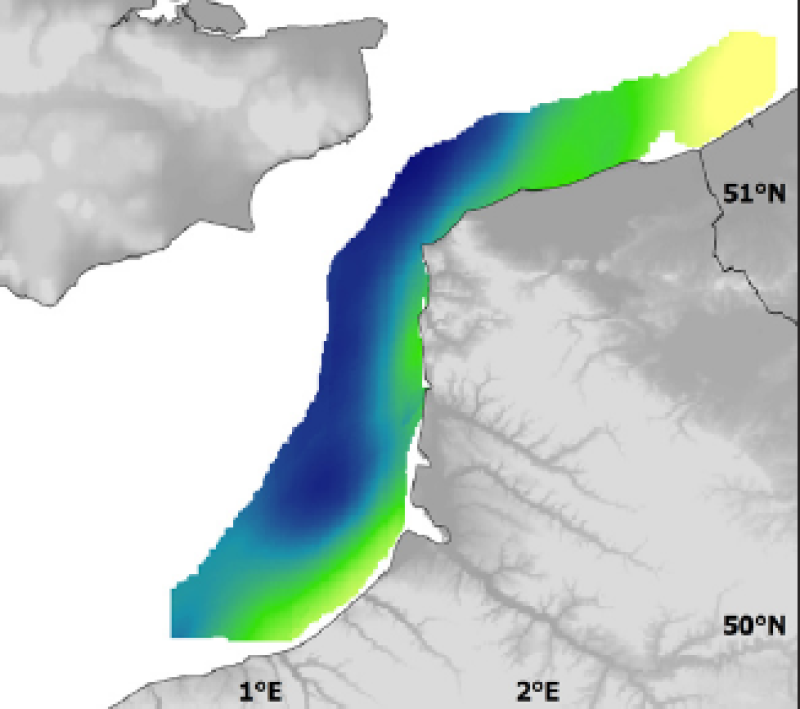
Physical environment - In situ data - Mean fluorescence collected during the REISE2 survey in May 1995
Three environmental parameters were measured in situ during the REISE2 survey in April 1995. Temperature and salinity were measured using a probe. Fluorescence (mean for the water column) was measured using a fluorometer. This survey gives illustration of spring conditions.
Simple
- Autres appellations ou acronymes
- REISE2_environment_geostatA
- Date ( Publication )
- 2009-12-31T00:00:00
- Identificateur
- CHARM_REISE2_FLUO_R
- Forme de la présentation
- Carte numérique
- Autres informations de référence
- Source CHARM Consortium
- Reconnaissance
- Université du Littoral Côte d'Opale
- Reconnaissance
- CHARM consortium
- Etat
- Finalisé
Point de contact
UPMC Univ Paris 06, UMR 7093, Laboratoire d'Océanographie de Villefranche
-
Philippe Koubbi
(
)
- Fréquence de mise à jour
- Lorsque nécessaire
- Thèmes Sextant ( Thème )
-
- /Physical Environment/Physical Habitats
- Mots clés ( Discipline )
-
- Species data set
- CHARM
- GEMET - INSPIRE themes, version 1.0 ( Thème )
-
- Habitats et biotopes
- external.theme.gemet ( Thème )
-
- ressource halieutique
- Limitation d'utilisation
- research-only
- Contraintes d'accès
- Licence
- Autres contraintes
- Has to be cited this way in maps : "Source CHARM Consortium"
- Autres contraintes
- Has to be cited this way in bibliography : "Carpentier A, Martin CS, Vaz S (Eds.), 2009. Channel Habitat Atlas for marine Resource Management, final report / Atlas des habitats des ressources marines de la Manche orientale, rapport final (CHARM phase II). INTERREG 3a Programme, IFREMER, Boulogne-sur-mer, France. 626 pp. & CD-rom"
- Type de représentation spatiale
- Raster
- Dénominateur de l'échelle
- 1000
- Langue
- fr
- Langue
- en
- Jeu de caractères
- Utf8
- Catégorie ISO
-
- Océans
- Description de l'environnement de travail
- Microsoft Windows XP ; ESRI ArcGIS 9.x
- Identifiant géographique
- Eastern English Channel
N
S
E
W
))
- Nom du système de référence
- EPSG / WGS 84 (EPSG:4326) / 7.4
- Dimensions
- 2
- Noms des axes
- Axe - X
- Nombre de pixel
- 563
- Résolution
- 0.009 degree
- Noms des axes
- Axe - Y
- Nombre de pixel
- 457
- Résolution
- 0.009 degree
- Type de raster
- Surface
- Disponibilité des paramètres de transformation
- Non
Distributeur
- Ressource en ligne
-
CHARM web site
(
WWW:LINK
)
CHARM web site
- Protocole
- COPYFILE
- Nom
- Mean fluorescence
- Description
- Mean fluorescence
- Ressource en ligne
-
CHARM_REISE2_FLUO_R
(
OGC:WMS
)
Mean fluorescence
- Niveau
- Jeu de données
- Généralités sur la provenance
- In 1995, two “REISE” surveys were held: these surveys looked at ichthyoplankton between the Schelde and Seine estuaries. There were 60 stations sampled in May 1995 (REISE 2). Ichthyoplankton was collected with a double-framed bongo net (plankton nets with 500 μm mesh). Oblique tows were carried out at 2 knots from the surface to the proximity of the seabed.
- Description
- Statistical analysis : the statistical distribution of environmental data were tested for normality (histograms, skewness, kurtosis). The data were transformed whem skewness value exceeded |1| and/or kurtosis exceeded 1 and if a normalising function that could improve the data distribution was found. Environmental variables were measured on scales based on analytical conventions that are unrelated to the natural processes generated them. Therefore, any transformed scale is as appropriate as those on which these data were originally recorded. Geostatistical interpolation : the spatial variation of environmental data were analysed using GENSTAT (GENSTAT 7 Committee, 2004), which is a GENeral STATistics package including the main geostatistical tools. It computes experimentala variograms, fits these with various authorised mathematical models and uses them to calculate kriged estimates on a fine regular grid (of latitudes and longitudes). The grid of points was imported into ArcMap and interpolated with the Spatial Analyst extension in order to create a continuous raster of 1 km² resolution. The resulting maps illustrate the spatial distributions and the variations over time for environmental data studied in CHARM's area. For legends of maps, approximates od the 5th and the 95th quantiles were used for the minimales and maximales values respectively.
- Description
- REISE2 survey, scientific survey of ULCO
- Identifiant de la fiche
- d81142ea-5331-4a19-ad59-b5a078062d73 XML
- Langue
- en
- Jeu de caractères
- Utf8
- Type de ressource
- Jeu de données
- Date des métadonnées
- 2020-06-04T00:29:44
- Nom du standard de métadonnées
- ISO 19115:2003/19139 - SEXTANT
- Version du standard de métadonnées
- 1.0
Aperçus
Étendue spatiale
N
S
E
W
Fourni par

Ressources associées
Not available