 Mon GéoSource
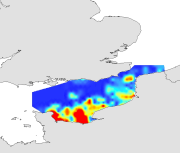
Species and habitats - Sardina pilchardus - All ages - Multi-annual abundance in October during CGFS (1988-2009)
Biologic data have been expressed in abundance (numbers or density values (nbr/km²)) and always required to be log-transformed using a log10(x+1) transformation.
Simple
- Alternate title
- CGFS_species_geostatP
- Date ( Publication )
- 2012-01-24T00:00:00
- Identifier
- CHARM_SARDPIL_CGFS_1988-2009
- Presentation form
- Digital map
- Other citation details
- Source CHARM Consortium
- Credit
- IFREMER
- Credit
- CHARM consortium
- Status
- Completed
- Maintenance and update frequency
- As needed
- Keywords ( Discipline )
-
- Species data set
- CHARM
- Sardine commune
- Sardine d'Europe
- European pilchard
- Sardine
- GEMET - INSPIRE themes, version 1.0 ( Theme )
-
- Répartition des espèces
- external.theme.gemet ( Theme )
-
- ressource halieutique
- Use limitation
- research-only
- Access constraints
- License
- Other constraints
- Has to be cited this way in maps : "Source CHARM Consortium"
- Other constraints
- Has to be cited this way in bibliography : "Carpentier A, Martin CS, Vaz S (Eds.), 2009. Channel Habitat Atlas for marine Resource Management, final report / Atlas des habitats des ressources marines de la Manche orientale, rapport final (CHARM phase II). INTERREG 3a Programme, IFREMER, Boulogne-sur-mer, France. 626 pp. & CD-rom"
- Spatial representation type
- Grid
- Denominator
- 2500
- Metadata language
- fr
- Metadata language
- en
- Character set
- UTF8
- Topic category
-
- Oceans
- Biota
- Environment
- Environment description
- Microsoft Windows XP ; ESRI ArcGIS 9.x
- Geographic identifier
- Eastern English Channel
N
S
E
W
))
- Begin date
- 1988-01-01
- End date
- 2006-12-31
- Reference system identifier
- WGS 84 (EPSG:4326)
- Number of dimensions
- 2
- Dimension name
- Column
- Dimension size
- 765
- Resolution
- 0.009 degree
- Dimension name
- Row
- Dimension size
- 1052
- Resolution
- 0.009 degree
- Cell geometry
- Area
- Transformation parameter availability
- No
Distributor
- Protocol
- COPYFILE
- Name
- Sardina pilchardus
- Description
- Sardina pilchardus
- OnLine resource
- CHARMIII_SARDPIL_CGFS2007_2009 ( OGC:WMS )
- Hierarchy level
- Dataset
- Statement
- The survey extends from the Eastern English Channel to the south of the North Sea, which corresponds to ICES divisions VIId and IVc. The study area is divided into rectangles of 15¿ latitude and 15¿ longitude using a systematic sampling strategy. The sampling gear is a high opening bottom trawl well adapted for catching demersal species, with a 10 mm mesh size (side knot) for catching juveniles. This sampling gear is polyvalent and is well adapted to the varying seabed types encountered in the study area.One or two 30 minutes hauls are performed within each rectangle of the CGFS grid (two in the coastal zone and one offshore). The fishing hauls are chosen using professional fishing plans or found by prospecting. The fishing method is standardised: sampling stations have been each year at similar locations and identical sampling gear is used. Since 1997, temperature and salinity (surface and bottom) are measured using a probe attached on the headrope of the trawl. At each sampling station, all the fish species are sorted, weighed, counted and measured. For certain commercial species, bony structures (otoliths) are collected.
- Description
- Due to data scarcity, it was not possible to produce annual maps of species abundance. These had to be averaged based on their position over all the available period. The resulting averaged dataset was mapped by kriging.Statistical analysis : the statistical distribution of biological data were tested for normality (histograms, skewness, kurtosis). The data were transformed whem skewness value exceeded |1| and/or kurtosis exceeded 1 and if a normalising function that could improve the data distribution was found. Biological variables were measured on scales based on analytical conventions that are unrelated to the natural processes generated them. Therefore, any transformed scale is as appropriate as those on which these data were originally recorded. Geostatistical interpolation : the spatial variation of biological data were analysed using GENSTAT (GENSTAT 7 Committee, 2004), which is a GENeral STATistics package including the main geostatistical tools. It computes experimentala variograms, fits these with various authorised mathematical models and uses them to calculate kriged estimates on a fine regular grid (of latitudes and longitudes). The grid of points was imported into ArcMap and interpolated with the Spatial Analyst extension in order to create a continuous raster of 1 km² resolution. The resulting maps illustrate the spatial distributions and the variations over time for biological data studied in CHARM's area. For legends of maps, approximates od the 5th and the 95th quantiles were used for the minimales and maximales values respectively.
- Description
- CGFS, annual scientific survey of IFREMER
- File identifier
- 2ea471b1-4429-421b-ad3b-f44349eb8181 XML
- Metadata language
- en
- Character set
- UTF8
- Hierarchy level
- Dataset
- Date stamp
- 2020-06-04T00:28:57
- Metadata standard name
- ISO 19115:2003/19139 - SEXTANT
- Metadata standard version
- 1.0
Overviews
Spatial extent
N
S
E
W
Provided by

Associated resources
Not available