 Mon GéoSource
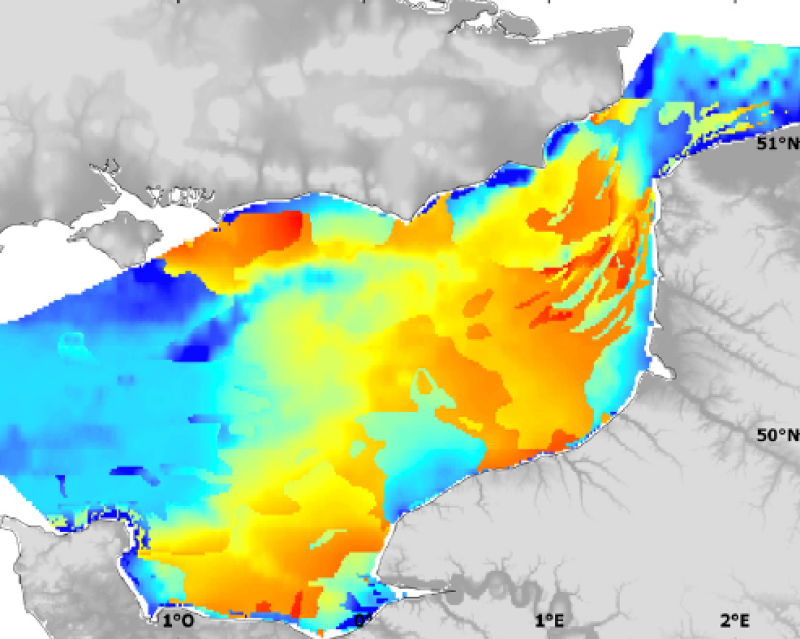
Species and habitats - Trachurus trachurus - Mature - Preferential habitat in October modelled by Generalised Linear Modelling and its uncertainty with CGFS data
Modelised abundance of species or prediction uncertainty.
Simple
- Alternate title
- CGFS_species_model
- Date ( Publication )
- 2009-12-31T00:00:00
- Identifier
- CHARM_TRACTRA_S1_CGFS_GLM_MOD_ERR_R
- Presentation form
- Digital map
- Other citation details
- Source CHARM Consortium
- Credit
- IFREMER
- Credit
- CHARM consortium
- Status
- Completed
- Maintenance and update frequency
- As needed
- Thèmes Sextant ( Theme )
-
- /Biological Environment/Species/Fish Species of Commercial Interest
- Keywords ( Discipline )
-
- Species data set
- CHARM
- GEMET - INSPIRE themes, version 1.0 ( Theme )
-
- Répartition des espèces
- external.theme.gemet ( Theme )
-
- ressource halieutique
- Use limitation
- research-only
- Access constraints
- License
- Other constraints
- Has to be cited this way in maps : "Source CHARM Consortium"
- Other constraints
- Has to be cited this way in bibliography : "Carpentier A, Martin CS, Vaz S (Eds.), 2009. Channel Habitat Atlas for marine Resource Management, final report / Atlas des habitats des ressources marines de la Manche orientale, rapport final (CHARM phase II). INTERREG 3a Programme, IFREMER, Boulogne-sur-mer, France. 626 pp. & CD-rom"
- Spatial representation type
- Grid
- Denominator
- 2500
- Metadata language
- fr
- Metadata language
- en
- Character set
- UTF8
- Topic category
-
- Oceans
- Biota
- Environment
- Environment description
- Microsoft Windows XP ; ESRI ArcGIS 9.x
- Geographic identifier
- Eastern English Channel
N
S
E
W
))
- Reference system identifier
- WGS 84 (EPSG:4326)
- Number of dimensions
- 2
- Dimension name
- Column
- Dimension size
- 500
- Resolution
- 0.009 degree
- Dimension name
- Row
- Dimension size
- 278
- Resolution
- 0.009 degree
- Cell geometry
- Area
- Transformation parameter availability
- No
Distributor
- OnLine resource
-
CHARM web site
(
WWW:LINK
)
CHARM web site
- OnLine resource
-
CHARM_TRACTRA_S1_CGFS_GLM_R
(
OGC:WMS
)
Preferential habitat
- OnLine resource
-
CHARM_TRACTRA_S1_CGFS_GLM_MOD_ERR_R
(
OGC:WMS
)
Model error
- Protocol
- COPYFILE
- Name
- Preferential habitat
- Description
- Preferential habitat
- Protocol
- COPYFILE
- Name
- Model error
- Description
- Model error
- Hierarchy level
- Dataset
- Statement
- In short, models based on GLMs predict the mean response of the species to environmental factors whilst models based on RQ predict the maximal response. When GLM uses abundance data, the preferential habitat is predicted, whilst the probable habitat is predicted when GLM uses binary presence-absence data. Generalised Linear Modelling (GLM) describes and predicts the "preferential habitat", i.e. the portion of the potential habitat that is used on average over time, or, in the case of presence-absence species data, the "probable habitat", i.e. where the species may be present. RQ tends to describe potential spatial patterns or the "potential habitat" of species, i.e. all possible areas with conditions suitable for the presence or high abundance levels of a species.
- Description
- GLM describes the mean response of a species abundance or presence probability according to environmental conditions (figure 2). In this type of model, a linear prediction is related to the mean of the response variable through a link function (e.g. identity function for a normally distributed variable, or logit function for binary data). Corresponding habitat models required a two step modelling procedure. The presence probability of the considered species as a function of environmental factors is first modelled using presence-absence data, independently from abundance data. Then, the response in terms of abundance is modelled in case of presence only. The species¿ habitat can finally be predicted by combining the presence-absence model with the model of abundance response in case of presence. This procedure allows circumventing the problem of atypical distribution of count data which include numerous observations with value zero, which is common in species abundance data (Stefánsson, 1996; Barry & Welsh, 2002). In this study, model selection was carried out by initially fitting a complete model including all available explanatory variables (continuous parameters were introduced as second order polynomials, nominal variables as factors and all first order interactions between environmental parameters were considered; note that interactions were not tested for the egg developmental stage). The selected environment predictors were: temperature, salinity, bed shear stress, depth, chlorophyll a concentration (only for the egg stage), fluorescence (only for the larval stage) and seabed sediment type. Although the first six factors were regarded as continuous covariables, sediment type (mud, fine sand, coarse sand, gravel and pebble) was introduced in the model as a categorical factor. The GLM model was optimised through backward selection based on Chi-square or F-test significance tests (Venables & Ripley, 2002). This approach was taken rather than Akaike Information Criterion reduction (or AIC; Akaike, 1974) to be coherent with quantile regression selection procedure which is also based on significance tests. For presence-absence data, binomial modelling with logit link function was chosen to obtain a prediction of the probability of presence of the species considered. For non-null abundance data (i.e. removing zero values), the data was log-transformed to achieve normality, and gaussian modelling with identity link function was used to predict positive density on a log scale. The predicted probability of presence was then multiplied with the positive density prediction, to obtain the final predicted value of abundance (Stefánsson, 1996). For each species considered, the equation of the final habitat model was used to recode digital maps of the environmental factors with the predicted abundance (or presence probability) of the species, using the Raster Calculator tool, thereby producing a habitat map. Prior to this and for each survey, digital (raster) maps of the environmental parameters had been limited to the ranges of values observed during the surveys, so as to avoid extrapolating outside the model development bounds. The resulting habitat maps were further centred and standardised, so that the resulting maps ranged between 0 and 1, thereby permitting an easier comparison amongst results from different stage, species or season (notable exceptions are the habitat maps based on binary data, and the larval stage habitat maps). The spatial distribution of the model error ratios was mapped for each model, the value of 1 corresponding to the maximum possible prediction error. The model prediction error can thus be interpreted as a percentage of model uncertainty.
- Description
- CGFS, annual scientific survey of IFREMER
- File identifier
- 5c8b271f-9a2d-4175-a932-307ac410dbde XML
- Metadata language
- en
- Character set
- UTF8
- Hierarchy level
- Dataset
- Date stamp
- 2020-06-04T00:38:48
- Metadata standard name
- ISO 19115:2003/19139 - SEXTANT
- Metadata standard version
- 1.0
Overviews
Spatial extent
N
S
E
W
Provided by

Associated resources
Not available