 Mon GéoSource
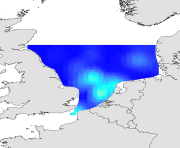
Species and habitats - Merlangius merlangus - Eggs - Stage 2- IBTS annual abundance in January 2006-2009
Simple
- Autres appellations ou acronymes
- IBTS_species_geostatA
- Date ( Publication )
- 2012-02-29T00:00:00
- Identificateur
- CHARM_MERNMER_eggs_st2_IBTS_2006-2009
- Forme de la présentation
- Carte numérique
- Autres informations de référence
- Source CHARM Consortium
- Reconnaissance
- IFREMER
- Reconnaissance
- CHARM consortium
- Etat
- Finalisé
- Fréquence de mise à jour
- Lorsque nécessaire
- Thèmes Sextant ( Thème )
-
- /Biological Environment/Species/Fish Species of Commercial Interest
- Mots clés ( Discipline )
-
- Species data set
- CHARM
- Merlan
- Whiting
- GEMET - INSPIRE themes, version 1.0 ( Thème )
-
- Répartition des espèces
- external.theme.gemet ( Thème )
-
- ressource halieutique
- Limitation d'utilisation
- research-only
- Contraintes d'accès
- Licence
- Autres contraintes
- Has to be cited this way in maps : "Source CHARM Consortium"
- Autres contraintes
- Has to be cited this way in bibliography : "Carpentier A, Martin CS, Vaz S (Eds.), 2009. Channel Habitat Atlas for marine Resource Management, final report / Atlas des habitats des ressources marines de la Manche orientale, rapport final (CHARM phase II). INTERREG 3a Programme, IFREMER, Boulogne-sur-mer, France. 626 pp. & CD-rom"
- Type de représentation spatiale
- Raster
- Dénominateur de l'échelle
- 2500
- Langue
- fr
- Langue
- en
- Jeu de caractères
- Utf8
- Catégorie ISO
-
- Océans
- Biote
- Environnement
- Description de l'environnement de travail
- Microsoft Windows XP ; ESRI ArcGIS 9.x
- Identifiant géographique
- Eastern English Channel
))
- Date de début
- 1989-01-01
- Date de fin
- 2007-12-31
- Nom du système de référence
- WGS 84 (EPSG:4326)
- Dimensions
- 2
- Noms des axes
- Axe - X
- Nombre de pixel
- 768
- Résolution
- 0.009 degree
- Noms des axes
- Axe - Y
- Nombre de pixel
- 660
- Résolution
- 0.009 degree
- Type de raster
- Surface
- Disponibilité des paramètres de transformation
- Non
Distributeur
- Ressource en ligne
-
CHARM_MERNMER_eggs_st2_IBTS_2006
(
OGC:WMS
)
Merlangius merlangus - Stade 2 - 2006
- Ressource en ligne
-
CHARM_MERNMER_eggs_st2_IBTS_2007
(
OGC:WMS
)
Merlangius merlangus - Stade 2 - 2007
- Ressource en ligne
-
CHARM_MERNMER_eggs_st2_IBTS_2008
(
OGC:WMS
)
Merlangius merlangus - Stade 2 - 2008
- Ressource en ligne
-
CHARM_MERNMER_eggs_st2_IBTS_2009
(
OGC:WMS
)
Merlangius merlangus - Stade 2 - 2009
- Protocole
- COPYFILE
- Nom
- 2006
- Description
- Merlangius merlangus - Stade 2 - 2006
- Protocole
- COPYFILE
- Nom
- 2007
- Description
- Merlangius merlangus - Stade 2 - 2007
- Protocole
- COPYFILE
- Nom
- 2008
- Description
- Merlangius merlangus - Stade 2 - 2008
- Protocole
- COPYFILE
- Nom
- 2009
- Description
- Merlangius merlangus - Stade 2 - 2009
- Niveau
- Jeu de données
- Généralités sur la provenance
- The survey concerns the Dover Strait to the southern half of the North Sea.Its aim is to estimate fish abundance and distribution and to compute recruitment indices (abundance of juveniles) for the fish species exploited in the North Sea. In parallel to its regular actions, the French IBTS used a continuous fish egg pumping device called CUFES allowing the collection of information on the spatial distribution of winter spawning areas and on the spawning habitat of several important species.
- Description
- Statistical analysis : the statistical distribution of biological data were tested for normality (histograms, skewness, kurtosis). The data were transformed when skewness value exceeded |1| and/or kurtosis exceeded 1 and if a normalising function that could improve the data distribution was found. Biological variables were measured on scales based on analytical conventions that are unrelated to the natural processes generated them. Therefore, any transformed scale is as appropriate as those on which these data were originally recorded. Geostatistical interpolation : the spatial variation of biological data were analysed using GENSTAT (GENSTAT 7 Committee, 2004), which is a GENeral STATistics package including the main geostatistical tools. It computes experimental variograms, fits these with various authorised mathematical models and uses them to calculate kriged estimates on a fine regular grid (of latitudes and longitudes). The grid of points was imported into ArcMap and interpolated with the Spatial Analyst extension in order to create a continuous raster of 1 km² resolution. The resulting maps illustrate the spatial distributions and the variations over time for biological data studied in CHARM's area. For legends of maps, approximates of the 5th and the 95th quantiles were used for the minimales and maximales values respectively.
- Description
- IBTS, annual scientific survey of IFREMER
- Identifiant de la fiche
- 6235083e-5177-46c6-86d6-7dffafc70123 XML
- Langue
- en
- Jeu de caractères
- Utf8
- Type de ressource
- Jeu de données
- Date des métadonnées
- 2020-06-04T00:28:32
- Nom du standard de métadonnées
- ISO 19115:2003/19139 - SEXTANT
- Version du standard de métadonnées
- 1.0
Aperçus
Étendue spatiale
Fourni par
