 Mon GéoSource
/Metropolitan France/Celtic Seas
Type of resources
Available actions
Topics
INSPIRE themes
Keywords
Contact for the resource
Provided by
Years
Representation types
Update frequencies
status
Scale
Resolution
-
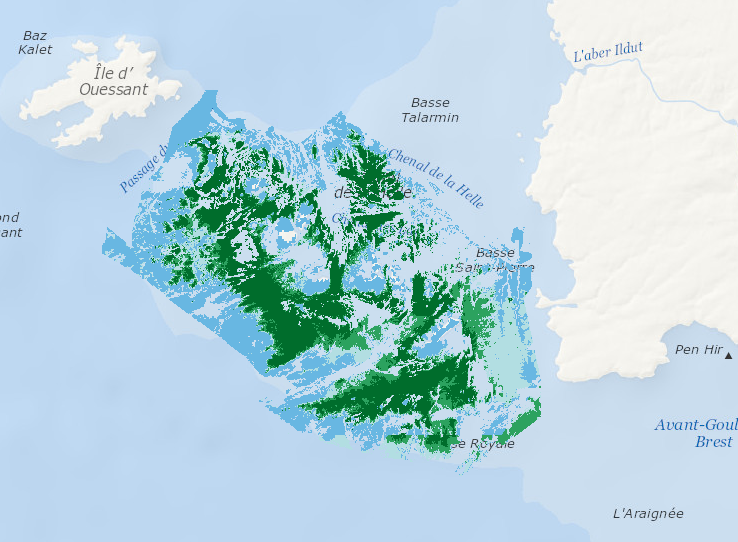
Data represents percentage cover of kelp forest as well as biomass of the 2 main species: L. digitata and L. hyperoborea. The used approach consists in firstly establishing surveys and appropriate processing methods in order to provide a detailed underwater topography of the area and to accurately delineate hard substrates (bedrock) potentially colonized by kelp. Secondly, a habitat suitability model is fitted for each species on some carefully selected field stations, measuring kelp presence/absence and biomass. Predictive maps are produced, based on hard substrate areas previously delineated.
-
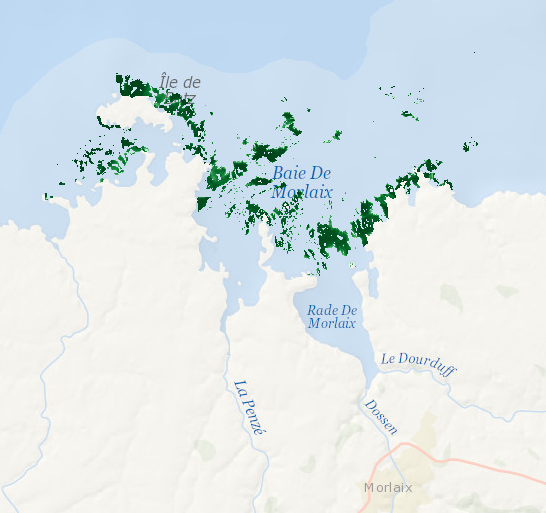
Data represents presence-absence prediction of kelp forest. Biological ground truth data were integrated with high resolution environmental datasets to develop statistical model that accurately predict the structure of Laminaria forests within the Bay of Morlaix. As a direct management output, high-resolution map (25 m2 grid) was produced.
-
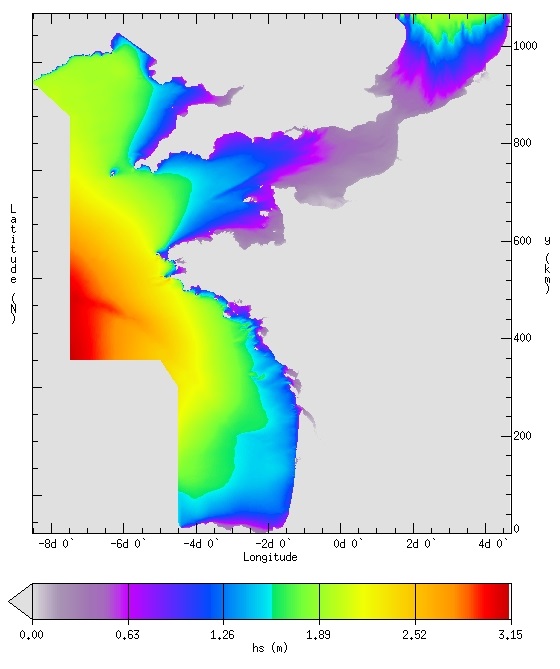
IOWAGA sea-states hindcast database generated by the wave model WAVEWATCH-III and forced by ECMWF winds on the French coast of the Atlantic ocean unstructured grid over 2008-2018 period.
-
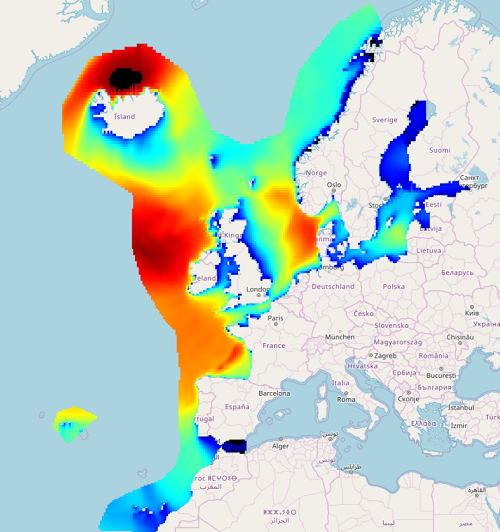
IOWAGA sea-states hindcast database generated by the wave model WAVEWATCH-III and forced by ECMWF winds on the North East Atlantic grid over 1990-2012 period.
-
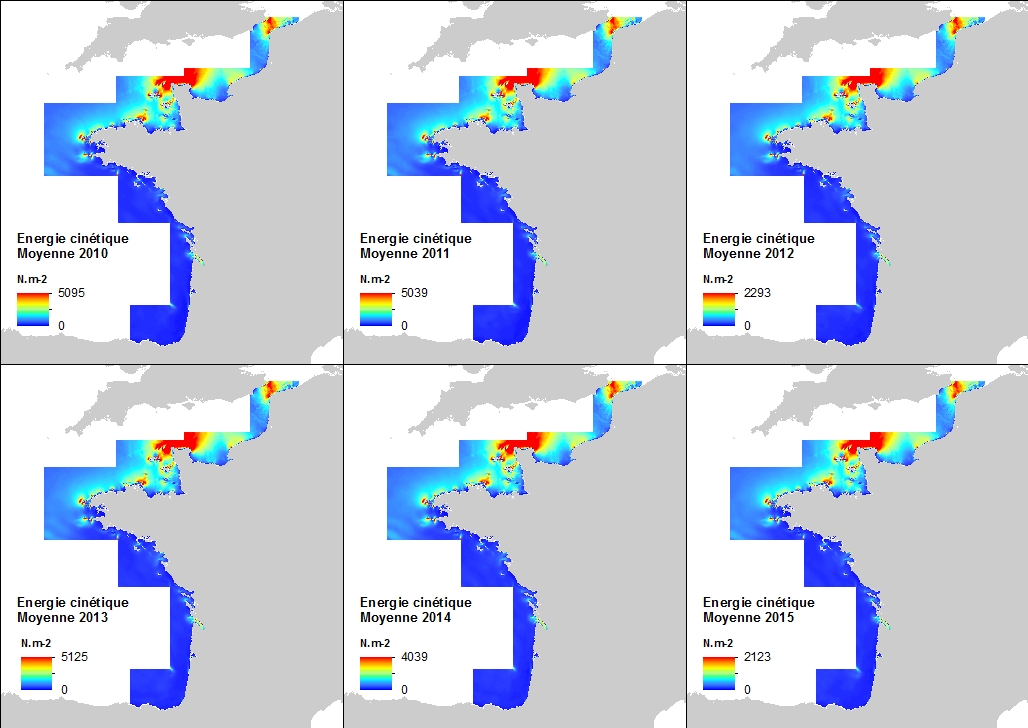
This annual statistics at 500m horizontal resolution was produced from the archived time series of MARS 3D physics model hindcast runs along French Atlantic Coast. The variable that is available here is the Kinetic Energy induced by currents caused by tide, water density gradients and action of winds. The formula used for the Kinetic Energy calculation is 0.5mv², where m is the density of seawater (1027 kg.m-3) and v is the current-induced velocity. Values are expressed in N.m-2 (Newton per square meter). The vertical level is the sea surface.
-
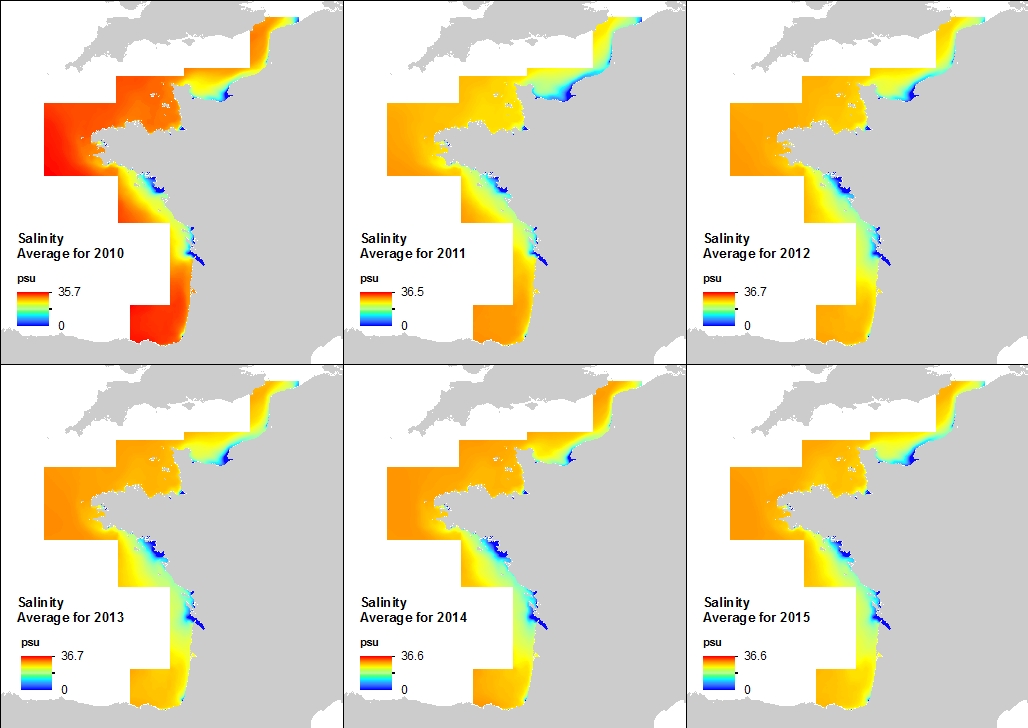
This annual statistics at 500m horizontal resolution was produced from the archived time series of MARS 3D physics model hindcast runs along French Atlantic Coast. The variable that is available here is the Salinity. Values are expressed in psu. The vertical level is the seabed.
-
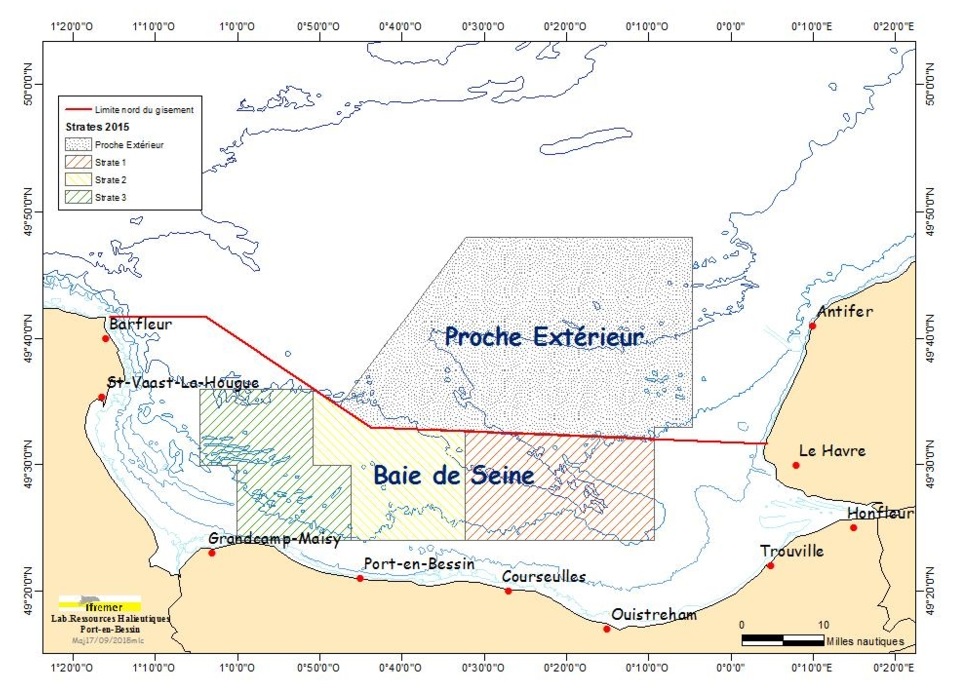
The COMOR cruises, which took place on the Thalia, aim to assess the abundance of the scallop stock (and if necessary to determine the presence of toxic algae) in the Seine Bay.
-
Occurrence data of strandings of marine mammals collected by the correspondents of the National Stranding Network (date, position, species) in metropolitan France in 2014-2020.
-
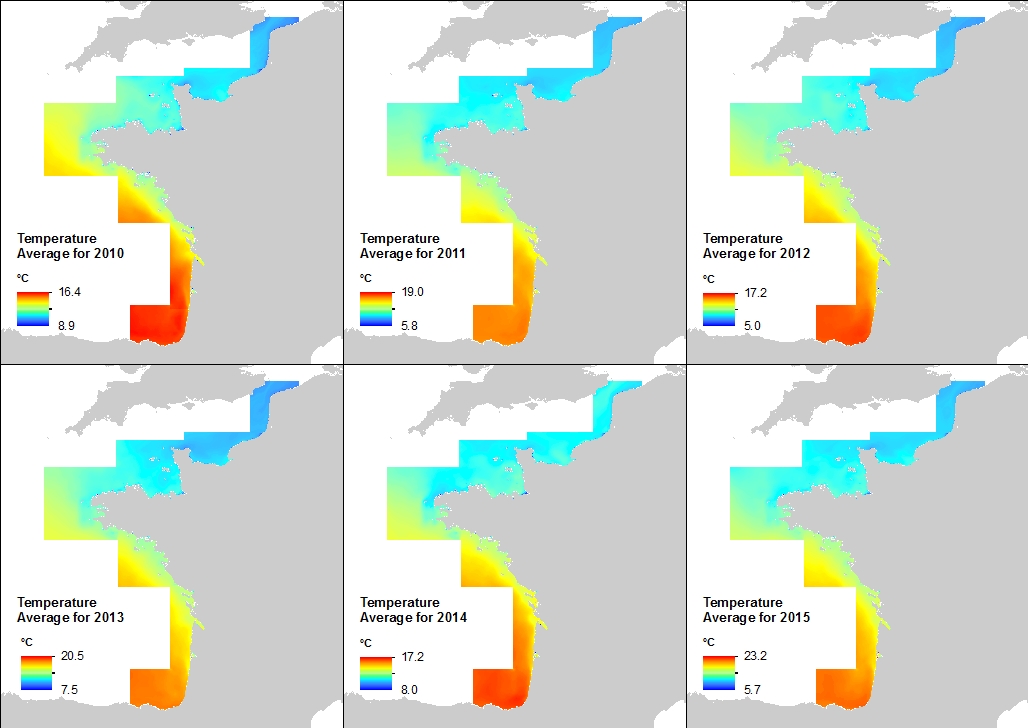
This annual statistics at 500m horizontal resolution was produced from the archived time series of MARS 3D physics model hindcast runs along French Atlantic Coast. The variable that is available here is Temperature. Values are expressed in Celsius degrees. In each pixel the value is an average of the values of the 40 vertical levels that are considered in the model.
-
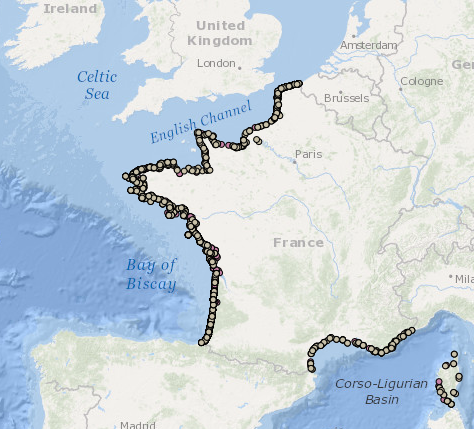
Vessel Monitoring System (VMS) data is the data from the Community's satellite-based fishing vessel monitoring system, which provides data on the position, course and speed of vessels to fisheries authorities at regular intervals.