 Mon GéoSource
Channel
Type of resources
Available actions
Topics
INSPIRE themes
Keywords
Provided by
Representation types
Update frequencies
status
Scale
-
This annual statistics at 500m horizontal resolution was produced from the archived time series of MARS 3D physics model hindcast runs along French Atlantic Coast. The variable that is available here is the Kinetic Energy induced by currents caused by tide, water density gradients and action of winds. The formula used for the Kinetic Energy calculation is 0.5mv², where m is the density of seawater (1027 kg.m-3) and v is the current-induced velocity. Values are expressed in N.m-2 (Newton per square meter). The vertical level is the sea surface.
-

This annual statistics at 500m horizontal resolution was produced from the archived time series of MARS 3D physics model hindcast runs along French Atlantic Coast. The variable that is available here is the Salinity. Values are expressed in psu. The vertical level is the seabed.
-

This annual statistics at 500m horizontal resolution was produced from the archived time series of MARS 3D physics model hindcast runs along French Atlantic Coast. The variable that is available here is Temperature. Values are expressed in Celsius degrees. In each pixel the value is an average of the values of the 40 vertical levels that are considered in the model.
-
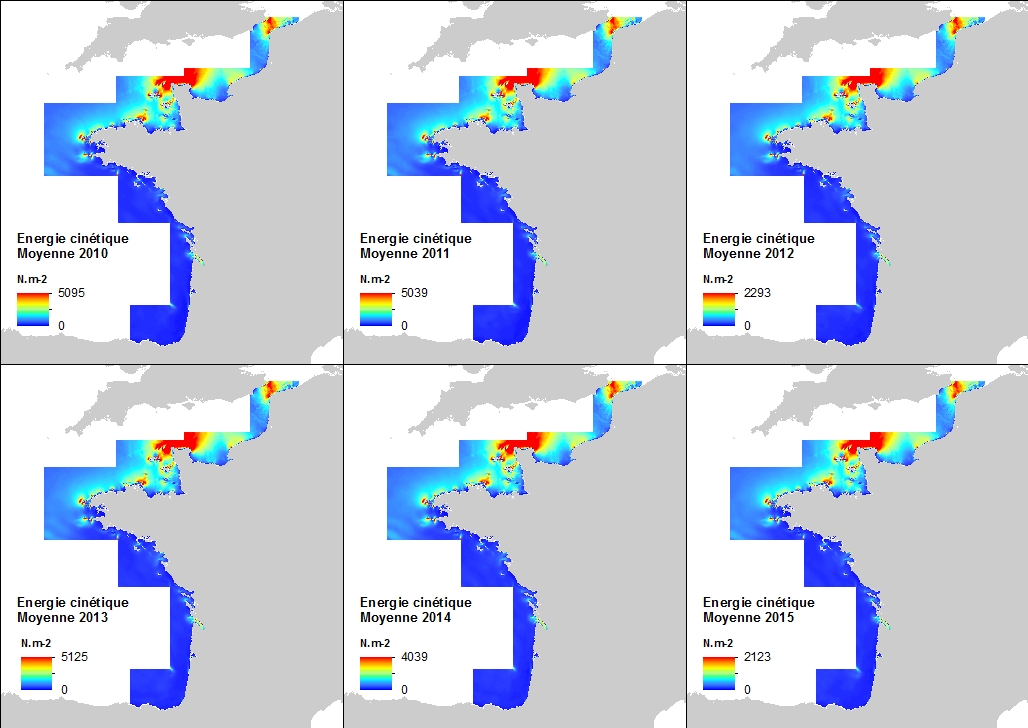
This annual statistics at 500m horizontal resolution was produced from the archived time series of MARS 3D physics model hindcast runs along French Atlantic Coast. The variable that is available here is the Kinetic Energy induced by currents caused by tide, water density gradients and action of winds. The formula used for the Kinetic Energy calculation is 0.5mv², where m is the density of seawater (1027 kg.m-3) and v is the current-induced velocity. Values are expressed in N.m-2 (Newton per square meter). In each pixel the value is an average of the values of the 40 vertical levels that are considered in the model.
-
This annual statistics at 500m horizontal resolution was produced from the archived time series of MARS 3D physics model hindcast runs along French Atlantic Coast. The variable that is available here is the Kinetic Energy induced by currents caused by tide, water density gradients and action of winds. The formula used for the Kinetic Energy calculation is 0.5mv², where m is the density of seawater (1027 kg.m-3) and v is the current-induced velocity. Values are expressed in N.m-2 (Newton per square meter). The vertical level is the seabed.
-
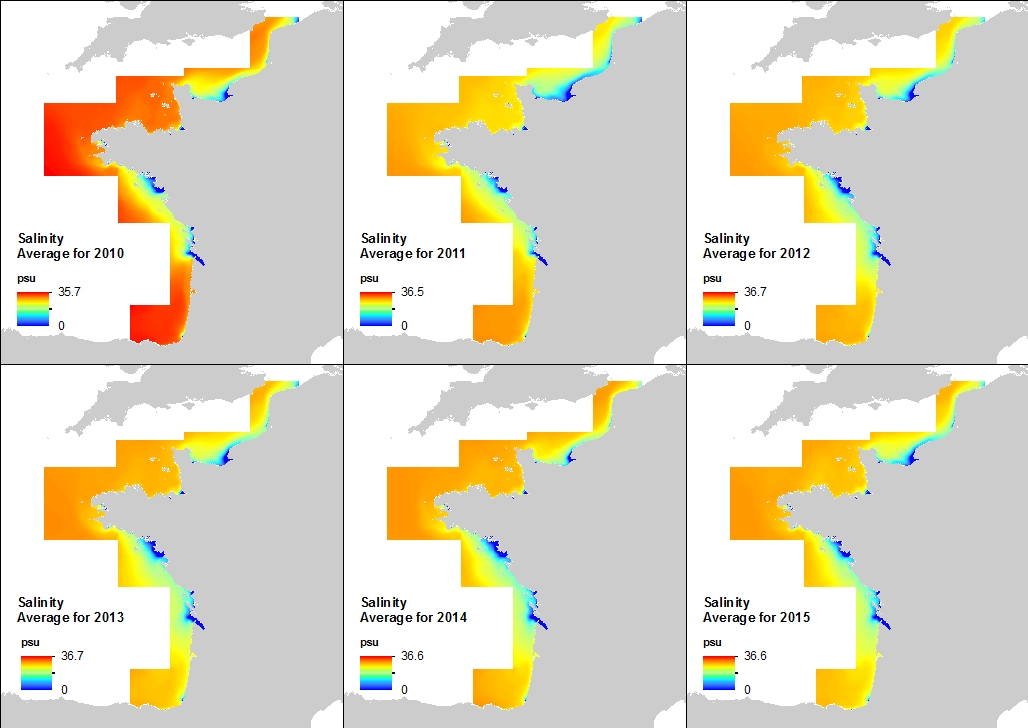
This annual statistics at 500m horizontal resolution was produced from the archived time series of MARS 3D physics model hindcast runs along French Atlantic Coast. The variable that is available here is Salinity. Values are expressed in psu. In each pixel the value is an average of the values of the 40 vertical levels that are considered in the model.
-
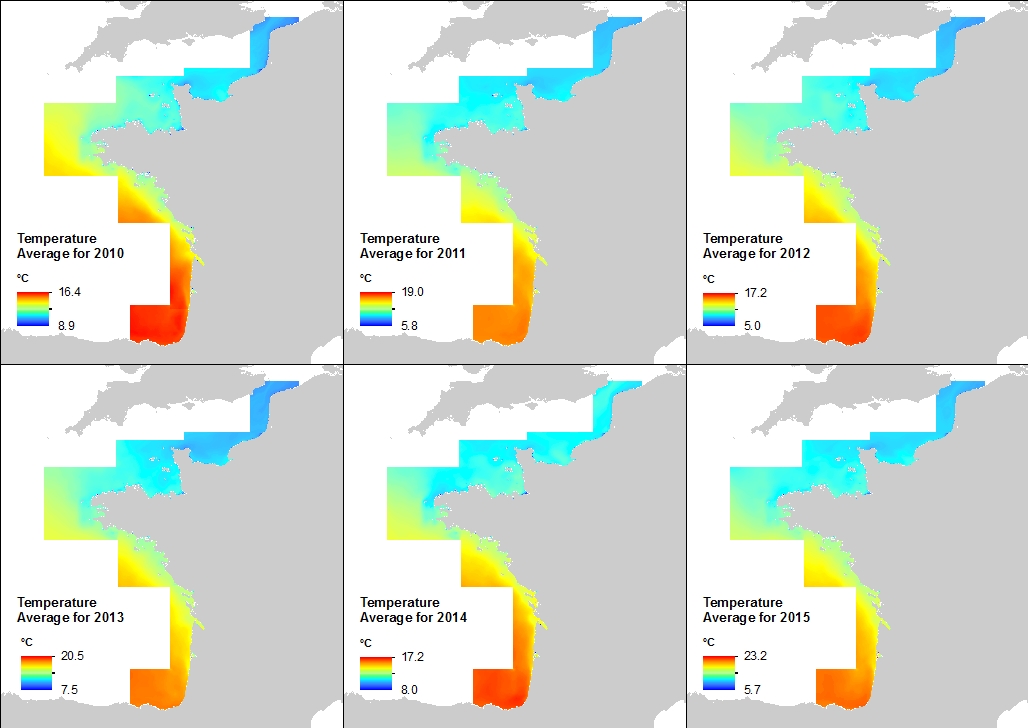
This annual statistics at 500m horizontal resolution was produced from the archived time series of MARS 3D physics model hindcast runs along French Atlantic Coast. The variable that is available here is the Temperature. Values are expressed in Celsius Degrees. The vertical level is the sea surface.
-

This annual statistics at 500m horizontal resolution was produced from the archived time series of MARS 3D physics model hindcast runs along French Atlantic Coast. The variable that is available here is the Salinity. Values are expressed in psu. The vertical level is the sea surface.
-

This annual statistics at 500m horizontal resolution was produced from the archived time series of MARS 3D physics model hindcast runs along French Atlantic Coast. The variable that is available here is the Temperature. Values are expressed in Celcius degrees. The vertical level is the seabed.
-
Visual Observations on the Dedicated Aerial Platform - 2. Sampling Programme- PACOMM/SAMM1 and SAMM2
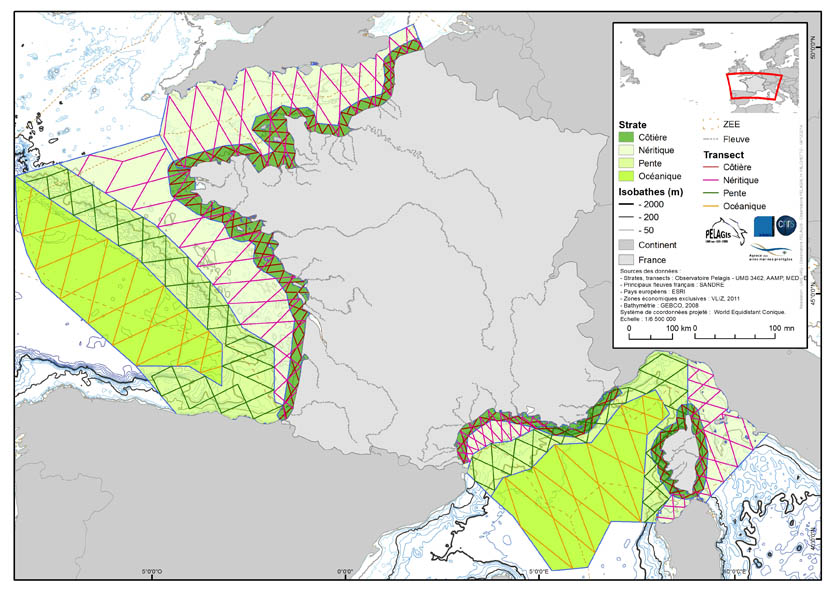
The associated data highlights the sampling programme for the data acquisition campaign of Observation on the Aerial Platform for the SAMM1and SAMM2 campaigns (Aerial Marine Megafauna Monitoring) conducted by the PELAGIS observatory (UMS 3462 ULR/CNRS). The sampling plan is composed of preestablished sampling strata and transects. These were drawn up according to the specific characteristic of the study area “Mainland France”, or FrM. Description of fields and values of allocation tables: : ( - field name, meaning: value, description of values) region char 5 Study area region_lbl char 50 labelled study area idCampagne (survey) char 15 Name of the campaign programme char 20 Programme name sector char 10 Sampling sector short ID strate char 5 Sampling strata short ID strate_lbl char 15 Labelled sampling strata areaKM double Strata surface area transect_name char 10 transect sampling length_km double Transect length start_x double Coordinates of the start of transect x in decimal degree start_y double Coordinates of the start of transect y in decimal degree end_x double Coordinates of the end of transect x in decimal degree end_y double Coordinates of the end of transect y in decimal degree