 Mon GéoSource
/Biological Environment/Species/Fish Species of Commercial Interest
Type of resources
Available actions
INSPIRE themes
Provided by
Representation types
Update frequencies
status
Scale
-
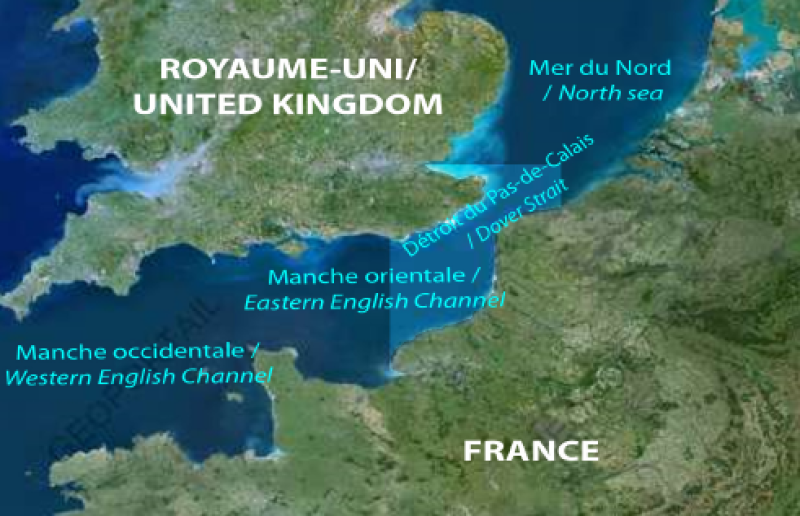
Polygons which delimited the geographical studied area of the CHARM I project and the CHARM II project. Polygons which delimited the geographical suggested area of the CHARM III project.
-
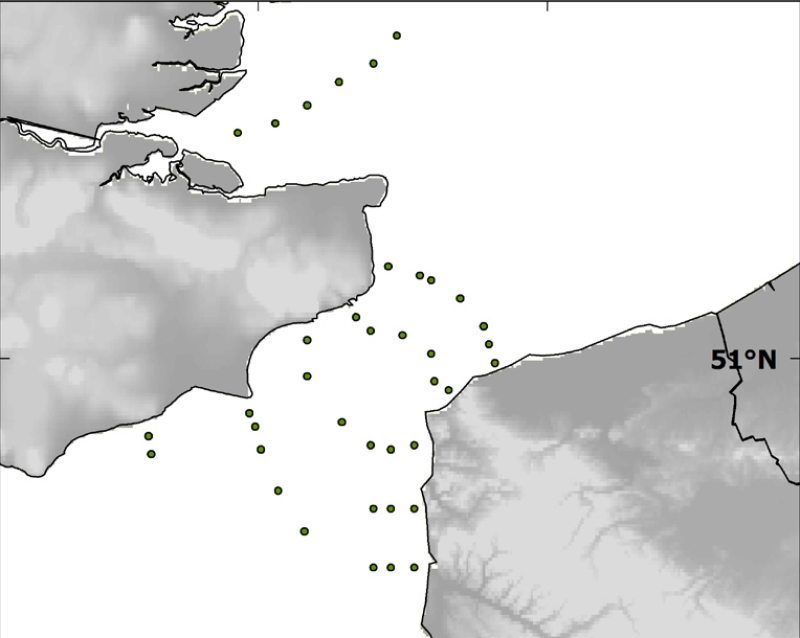
Localisation of the 39 sampled sites done during the BCD survey in April 1999.
-
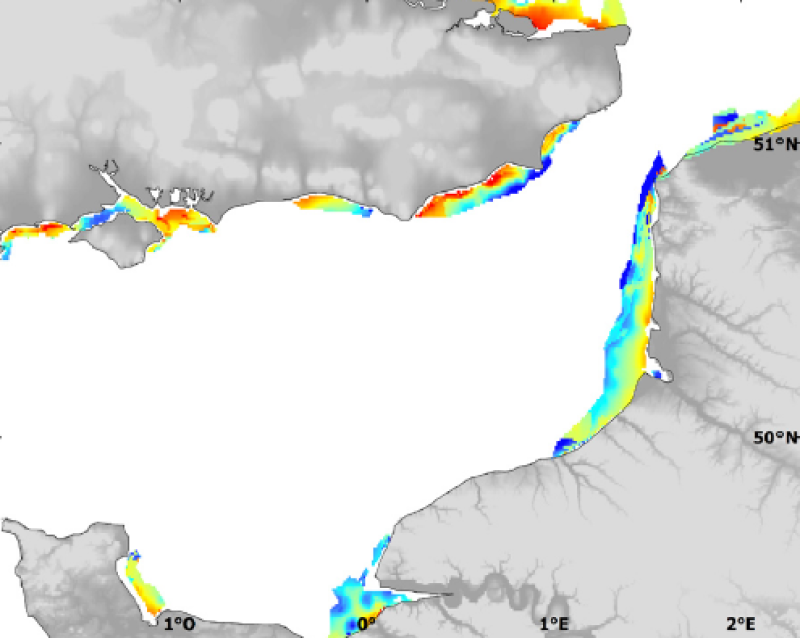
Modelised abundances of several species in coastal nurseries or prediction uncertainty.
-
Modelised adundance of several species eggs or prediction uncertainty.
-
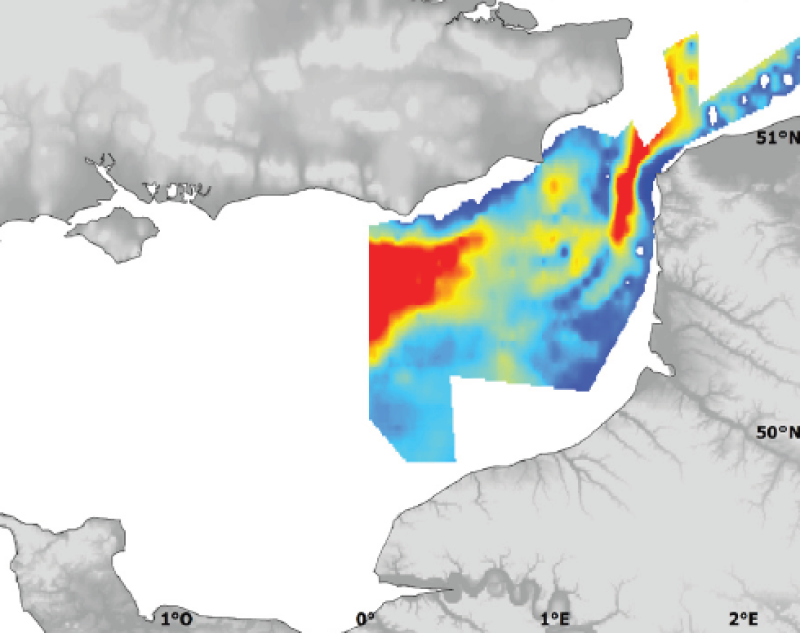
Modelised abundance of species or prediction uncertainty.
-
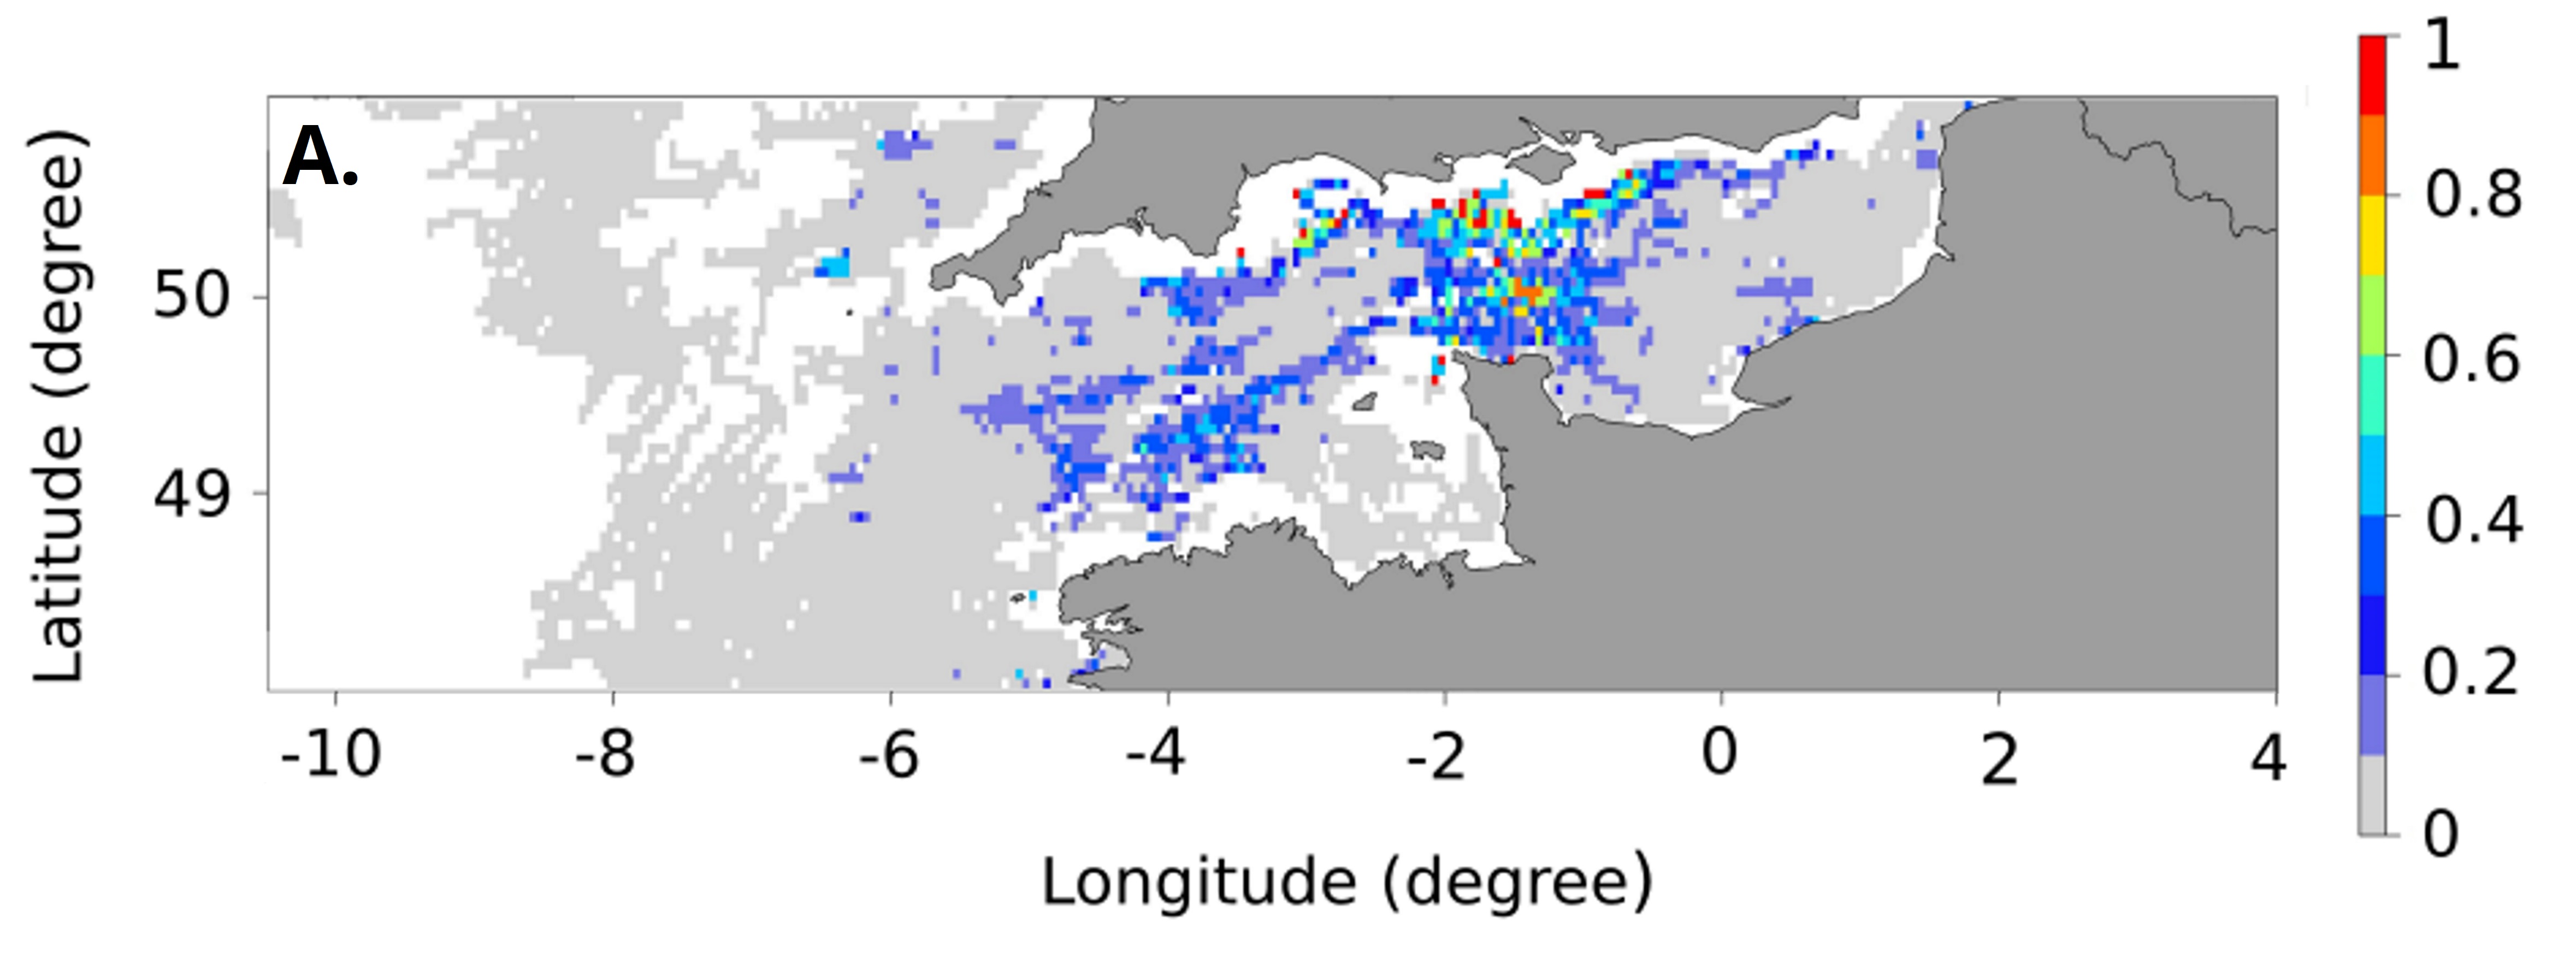
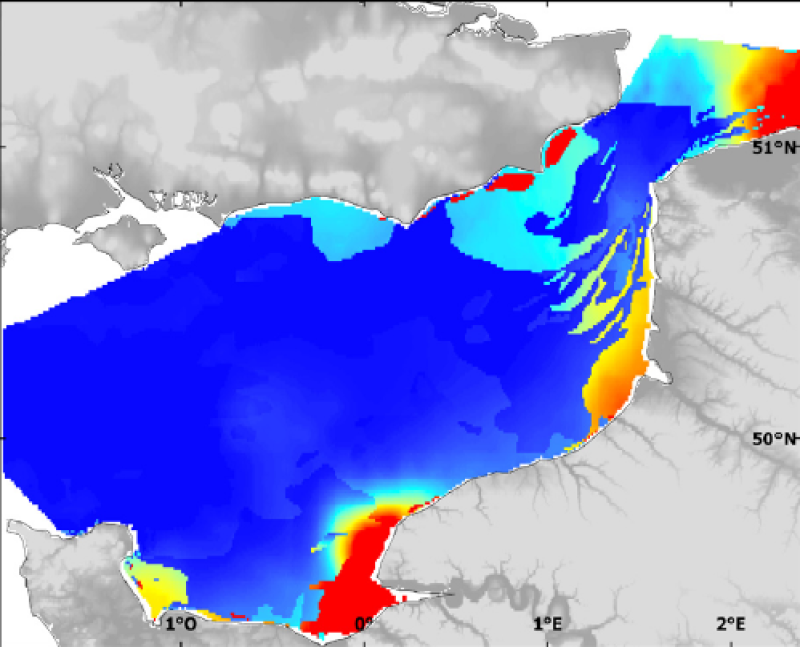
Ces cartes représentent la probabilité mensuelle d'être une frayère de bar pour chaque mois de la période de reproduction (de janvier à avril), et la probabilité moyenne d'être une frayère de bar sur l'ensemble des mois de reproduction en Manche - mer Celtique. Ces cartes de probabilité ont été calculées en réalisant une analyse géostatistique des données de pêche de navires géolocalisés, et ont une résolution spatiale de 3 par 3 miles nautiques.
-
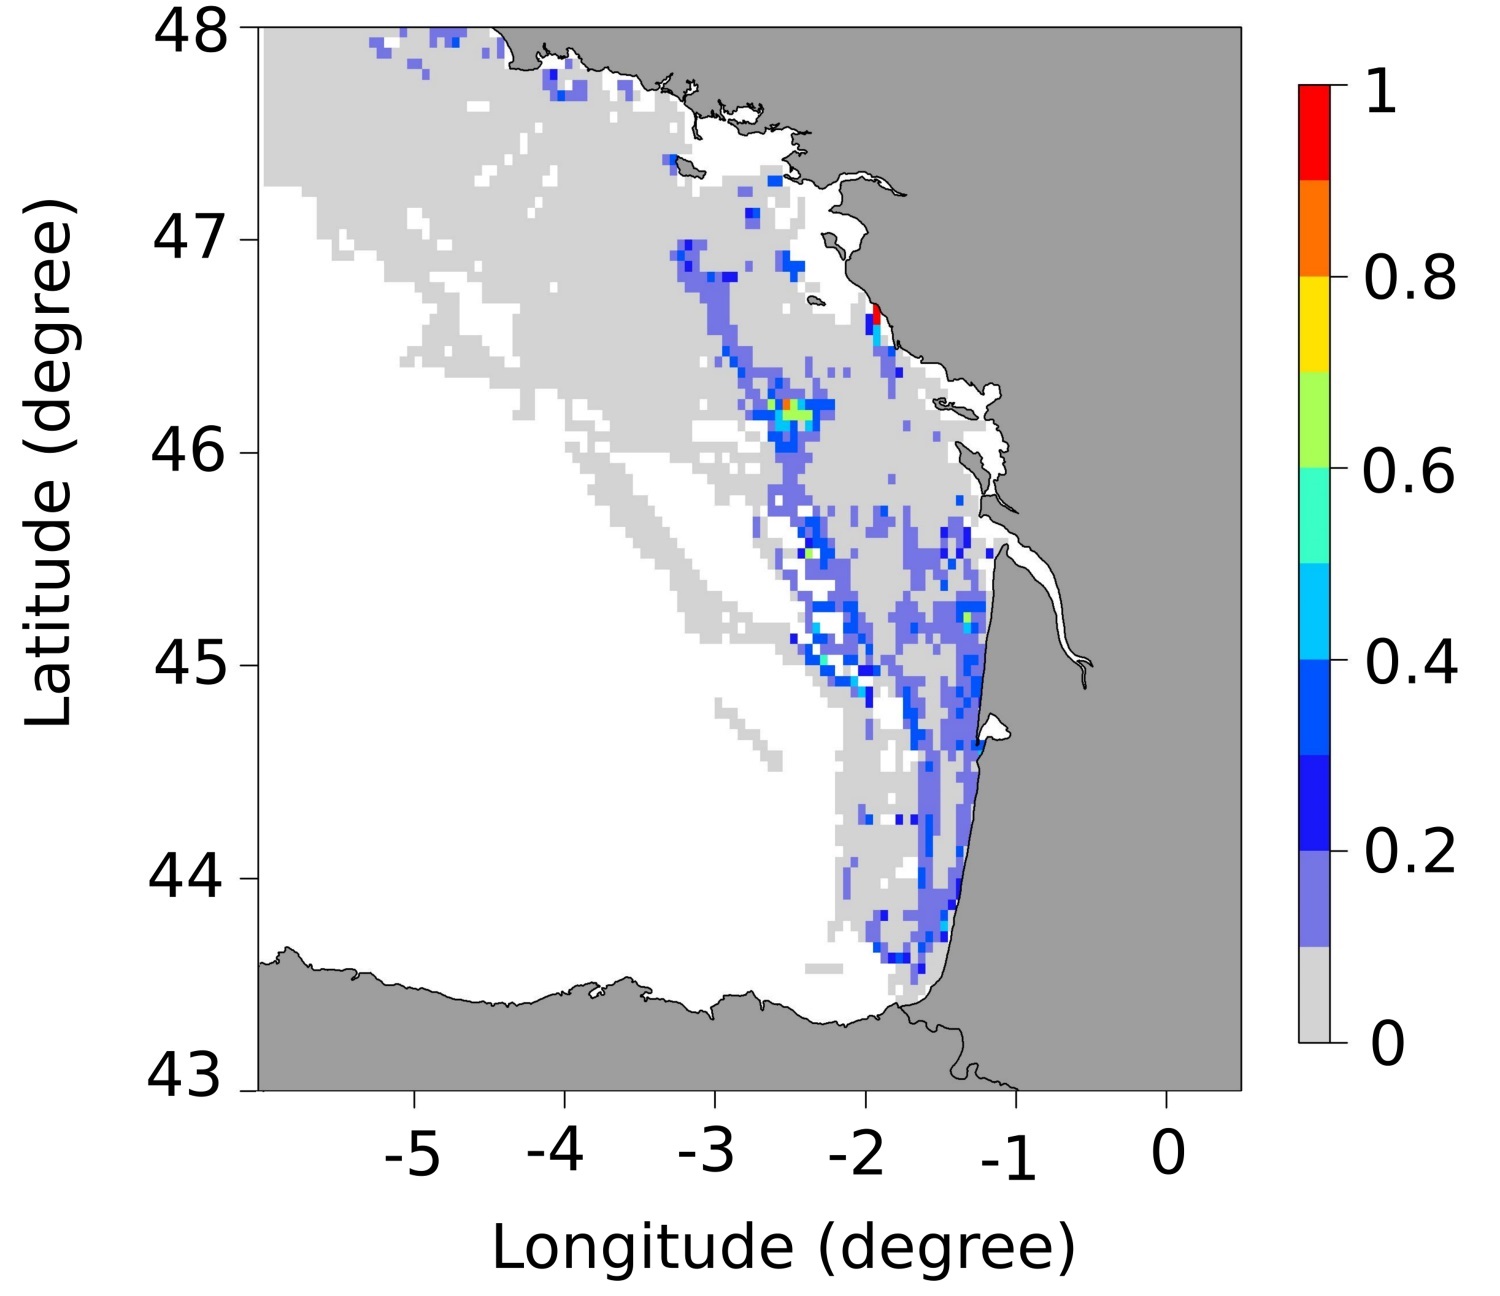
Ces cartes représentent la probabilité mensuelle d'être une frayère de bar pour chaque mois de la période de reproduction (de janvier à mars), et la probabilité moyenne d'être une frayère de bar sur l'ensemble des mois de reproduction dans le golfe de Gascogne. Ces cartes de probabilité ont été calculées en réalisant une analyse géostatistique des données de pêche de navires géolocalisés, et ont une résolution spatiale de 3 par 3 miles nautiques.
-
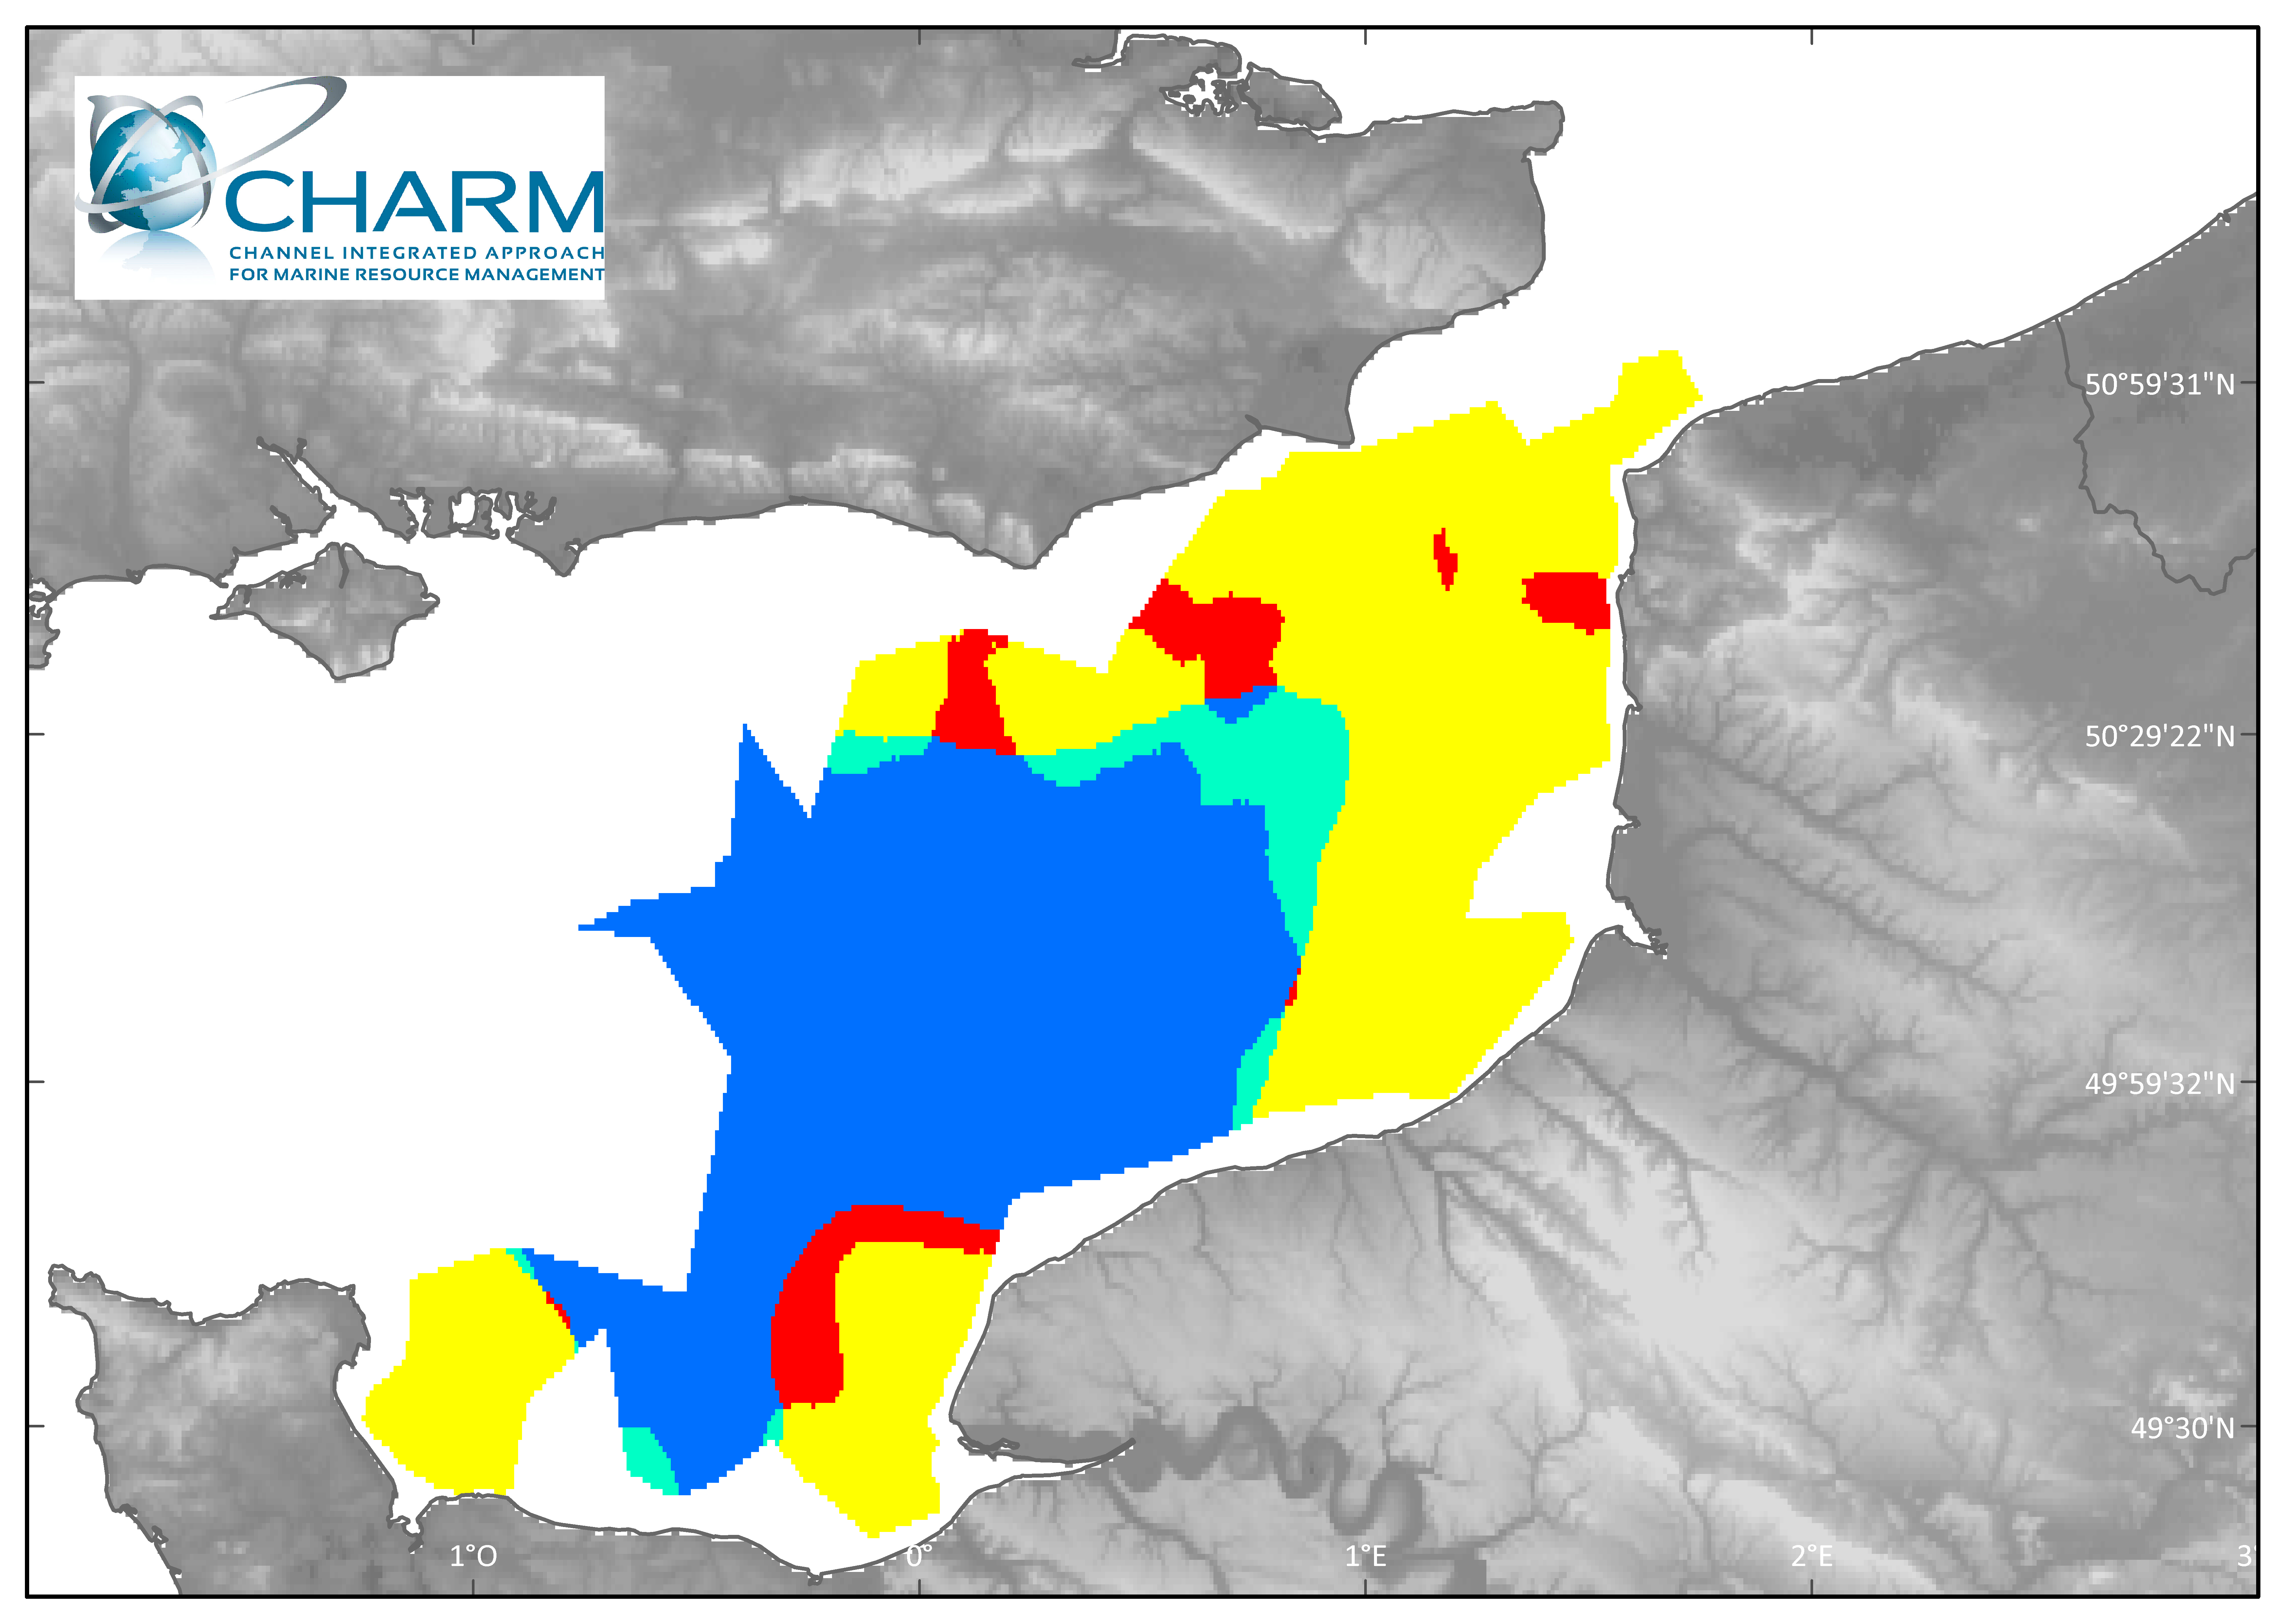
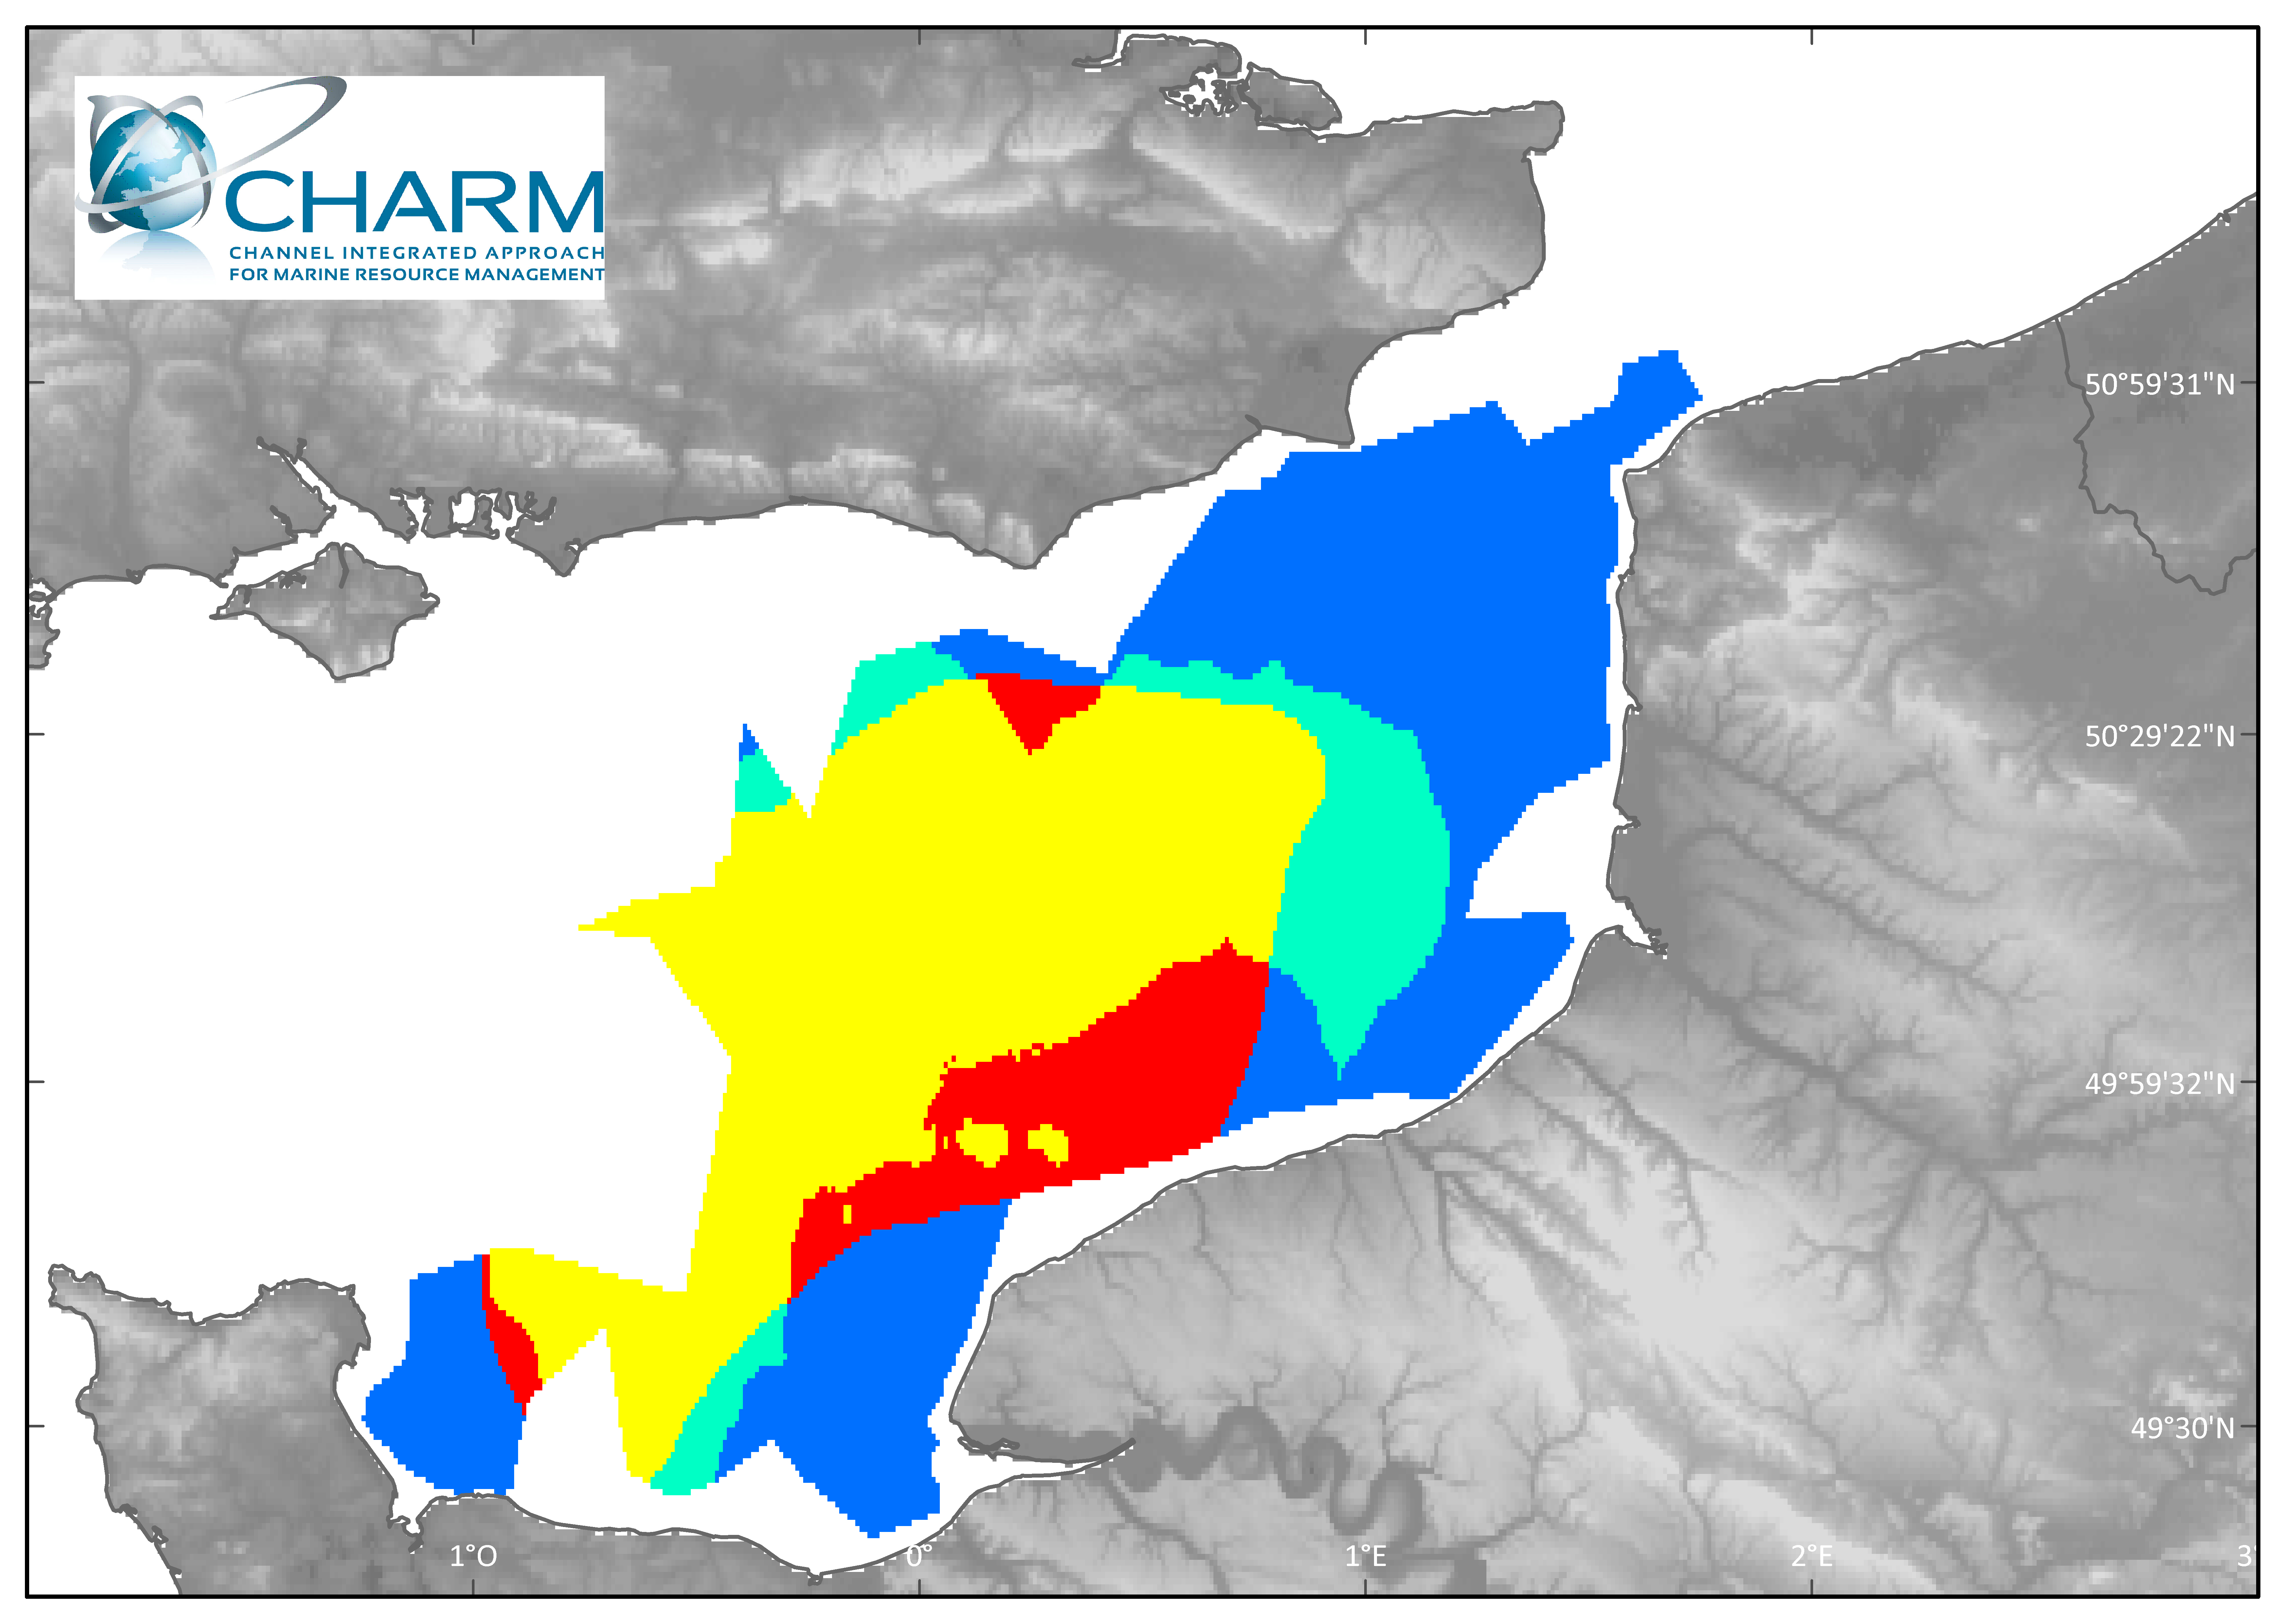
Species habitat occupation has been expressed as rare, occasional, frequent, recurrent depending on density levels and variability over time.
-
Species habitat occupation, observed during the third quarter IBTS from 1991 to 2010, has been expressed as rare, occasional, frequent, recurrent depending on density levels and variability over time.
-
Species habitat occupation has been expressed as rare, occasional, frequent, recurrent depending on density levels and variability over time.