 Mon GéoSource
dataset
Type of resources
Available actions
Topics
INSPIRE themes
Keywords
Contact for the resource
Provided by
Years
Formats
Representation types
Update frequencies
status
Service types
Scale
Resolution
-
Abstract
-
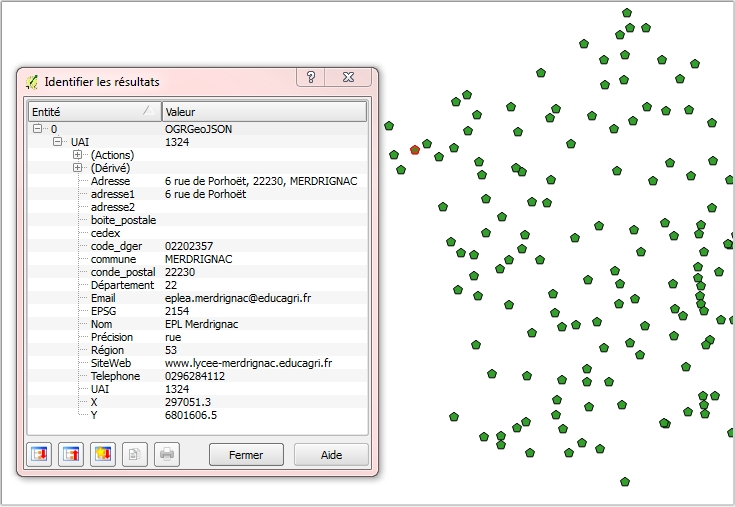
Géolocalisation des établissements publics locaux d’enseignement et de formation professionnelle agricoles : Position géographique des établissements en WGS84 (4326) sur l'ensemble du territoire (France métropolitaine et DOM COM). Attributs : Éléments de contact (nom,adresse, téléphone, mail..) et coordonnées géographiques officielles des établissements concernés. Mise à jour mensuelle. Information de précision des données : Dans la mesure du possible, la donnée est au bâtiment près ou à la rue; il existe cependant des cas où le centre de la commune est le point de référence (cf. champ "Précision").
-
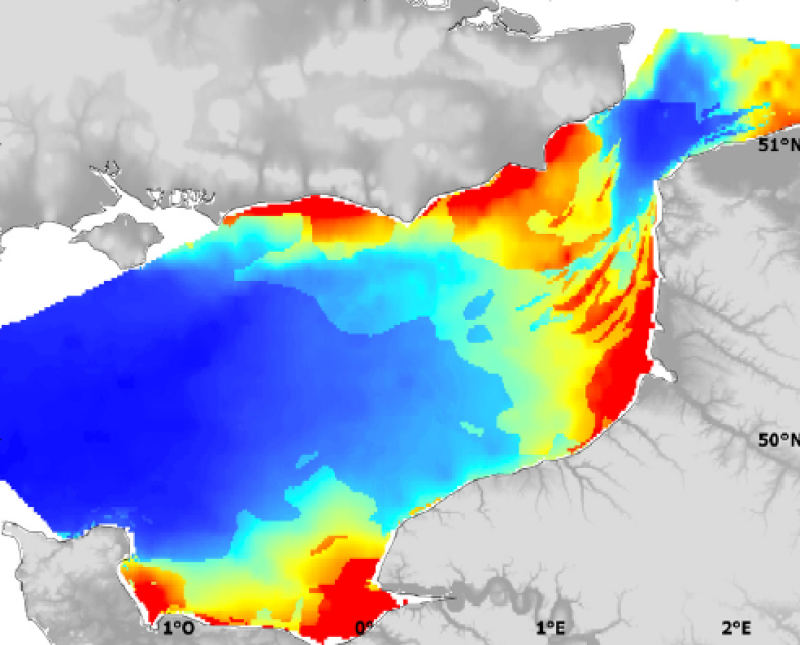
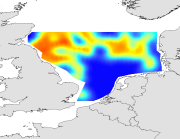
Biologic data have been expressed in abundance (numbers or density values (nbr/km²)) and always required to be log-transformed using a log10(x+1) transformation.
-
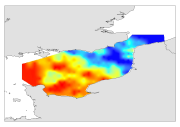
Modelised abundance of species or prediction uncertainty.
-
Abundances were recoded in term of presence-absence. Geostatistical interpolation : the spatial variation of biological data were analysed using GENSTAT (GENSTAT 7 Committee, 2004), which is a GENeral STATistics package including the main geostatistical tools. It computes experimentala variograms, fits these with various authorised mathematical models and uses them to calculate kriged estimates on a fine regular grid (of latitudes and longitudes). The grid of points was imported into ArcMap and interpolated with the Spatial Analyst extension in order to create a continuous raster of 1 km² resolution. The resulting maps illustrate the spatial distributions and the variations over time for biological data studied in CHARM's area. For legends of maps, approximates of the 5th and the 95th quantiles were used for the minimales and maximales values respectively.
-
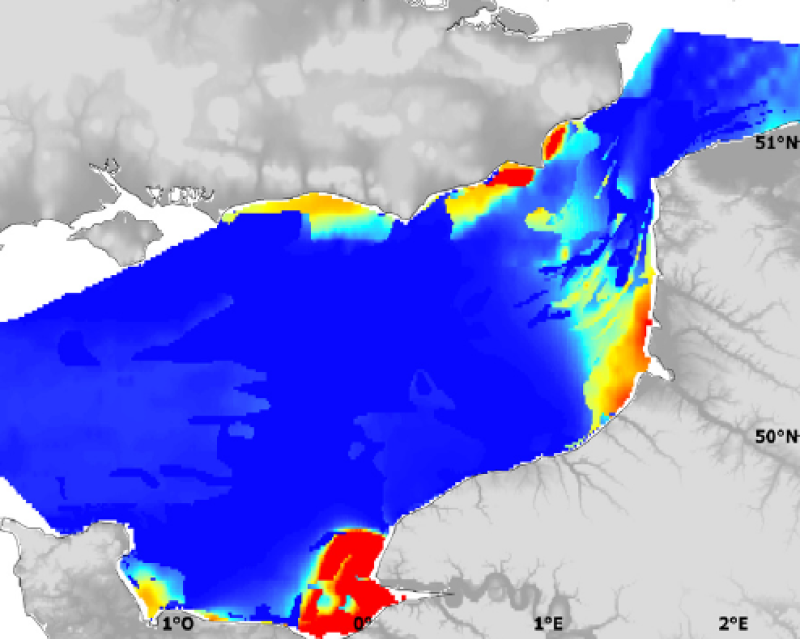
Modelised abundance of species or prediction uncertainty.
-
Biologic data have been expressed in abundance (numbers or density values (nbr/km²)) and always required to be log-transformed using a log10(x+1) transformation.
-
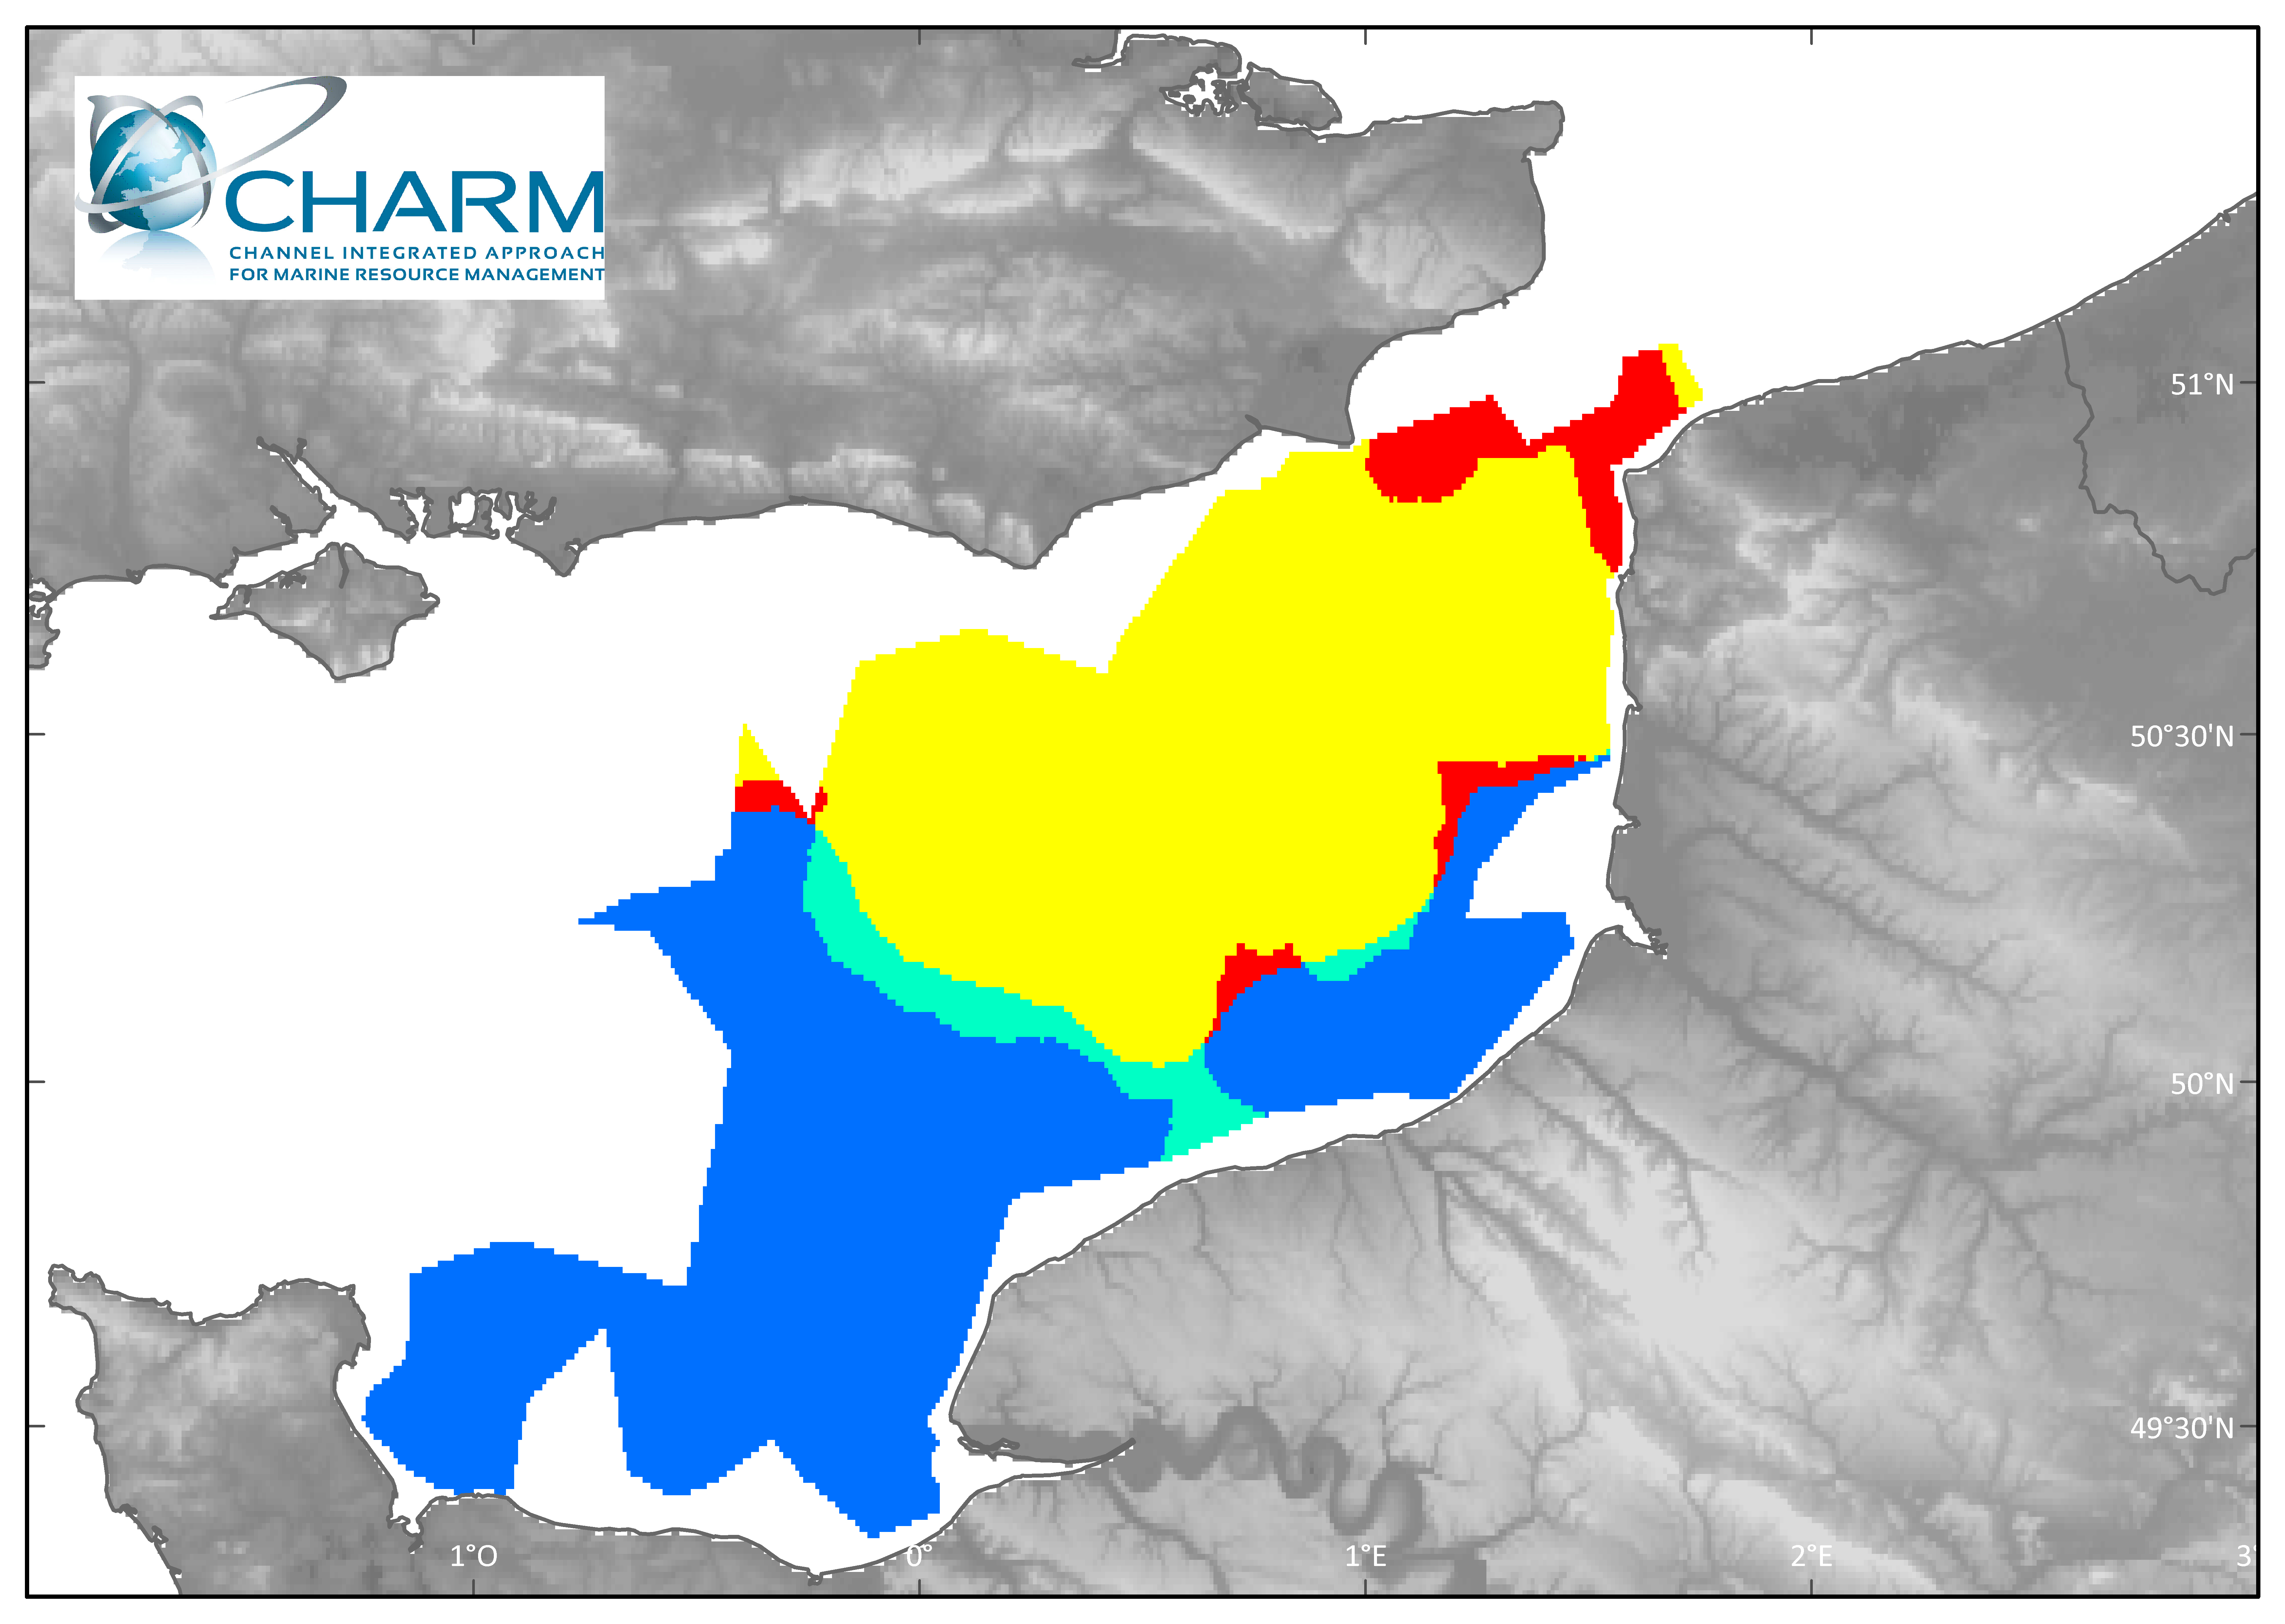
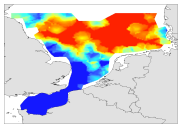
Species habitat occupation has been expressed as rare, occasional, frequent, recurrent depending on density levels and variability over time.
-
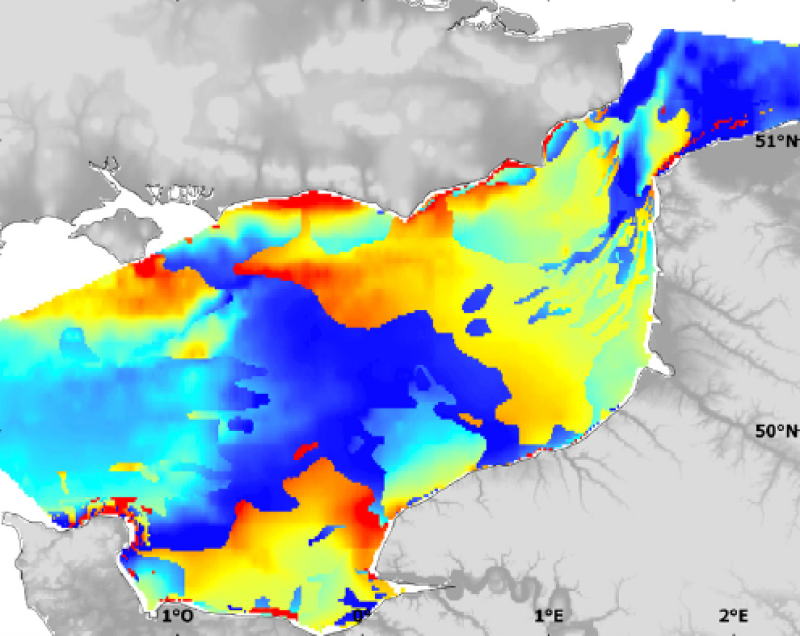
Modelised abundance of species or prediction uncertainty.
-
Biologic data have been expressed in abundance (numbers or density values (nbr/km²)) and always required to be log-transformed using a log10(x+1) transformation.