 Mon GéoSource
/Biological Environment/Species/Fish Species of Commercial Interest
Type of resources
Available actions
Topics
INSPIRE themes
Keywords
Contact for the resource
Provided by
Representation types
Update frequencies
status
Scale
-
Polygons which delimited the geographical studied area of the CHARM I project and the CHARM II project. Polygons which delimited the geographical suggested area of the CHARM III project.
-
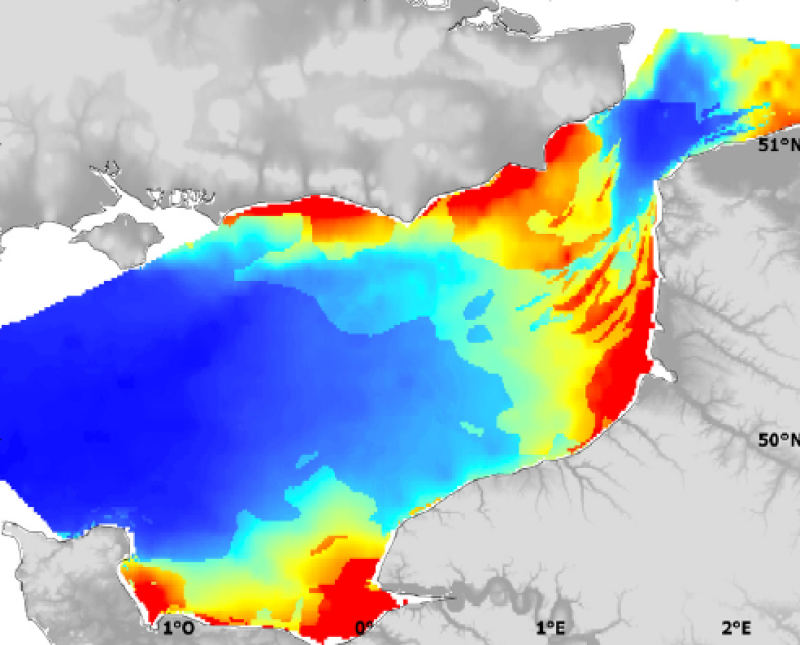
These maps represent the monthly probability of being a seabass spawning area for each month of the spawning season (January to April), and the mean probability of being a seabass spawning area over all spawning months in the English Channel - Celtic Sea. These probability maps were calculated by performing a geostatistical analysis of fishing data from geolocated vessels, and have a spatial resolution of 3 by 3 nautical miles.
-
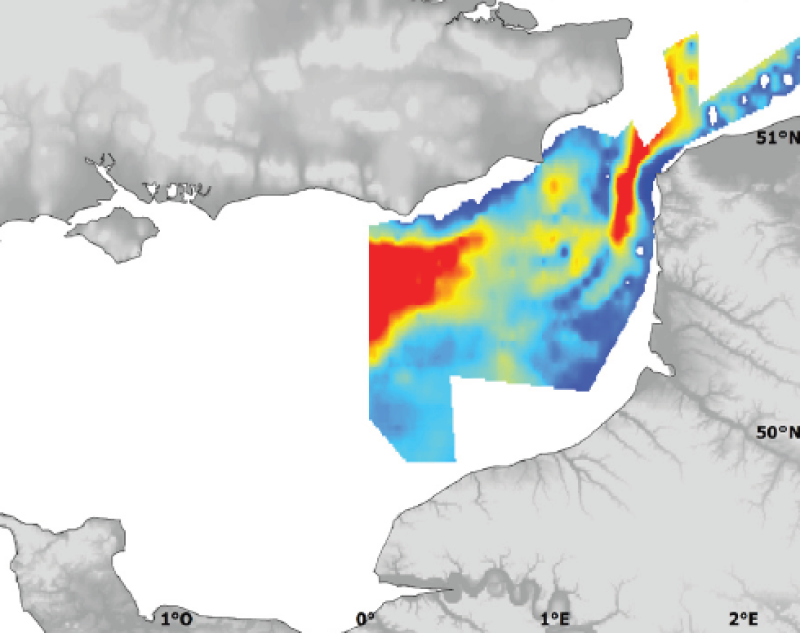
Modelised abundance of species or prediction uncertainty.
-
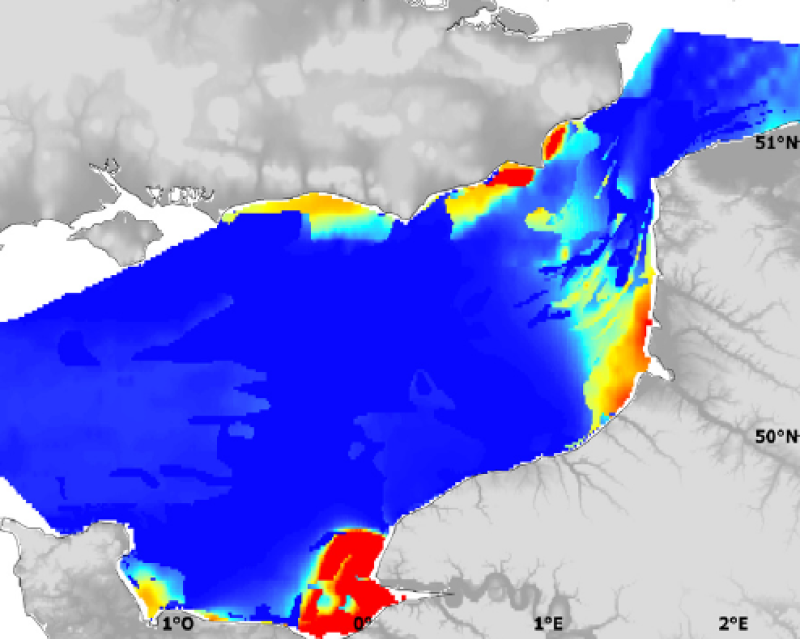
Modelised abundances of several species in coastal nurseries or prediction uncertainty.
-
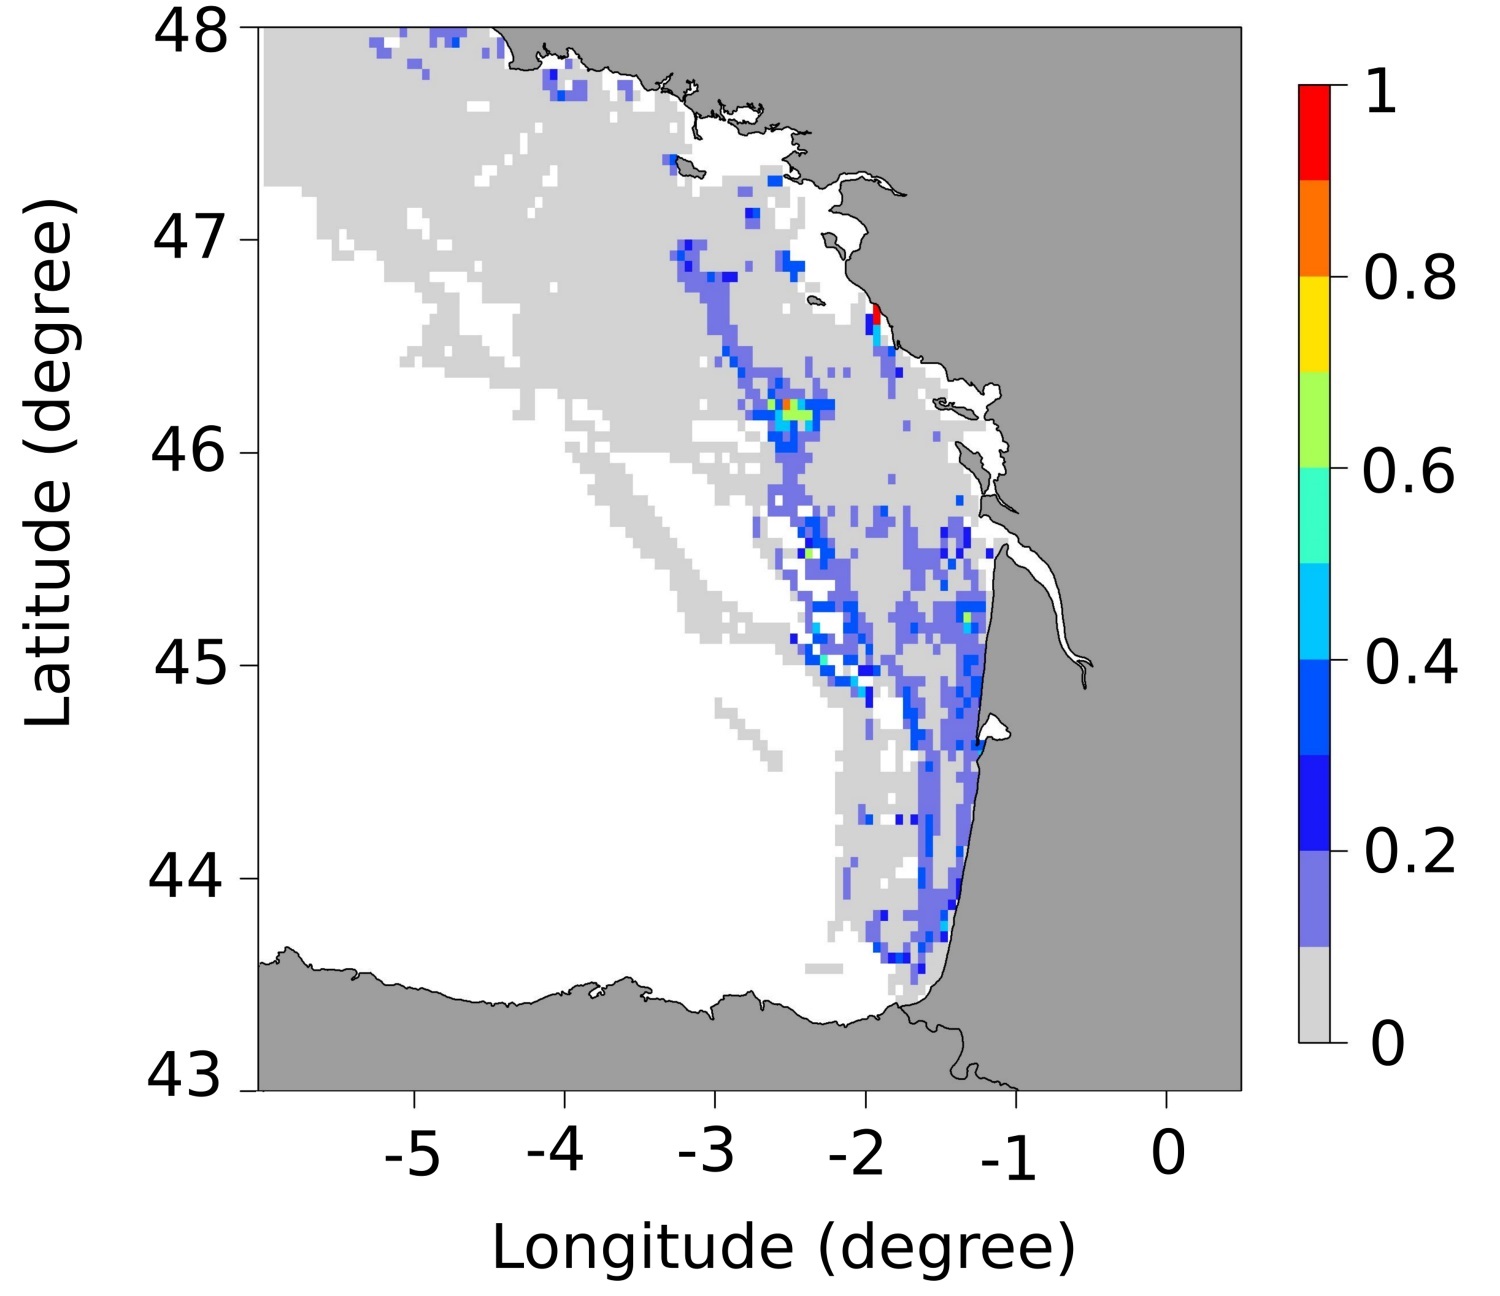
These maps represent the monthly probability of being a seabass spawning area for each month of the spawning season (January to March), and the mean probability of being a seabass spawning area over all spawning months in the Bay of Biscay. These probability maps were calculated by performing a geostatistical analysis of fishing data from geolocated vessels, and have a spatial resolution of 3 by 3 nautical miles.
-
Modelised adundance of several species eggs or prediction uncertainty.
-
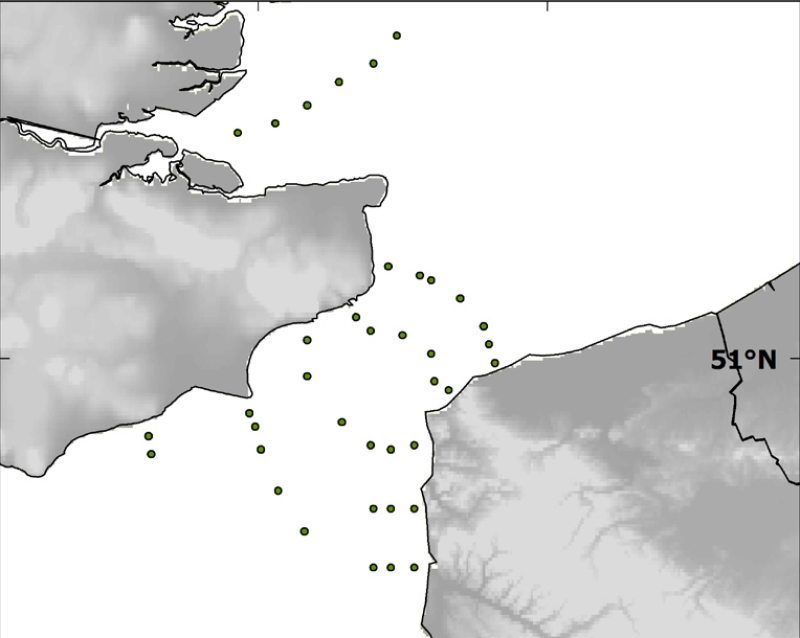
Localisation of the 39 sampled sites done during the BCD survey in April 1999.
-
Modelised abundance of species or prediction uncertainty.
-
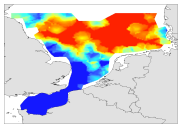
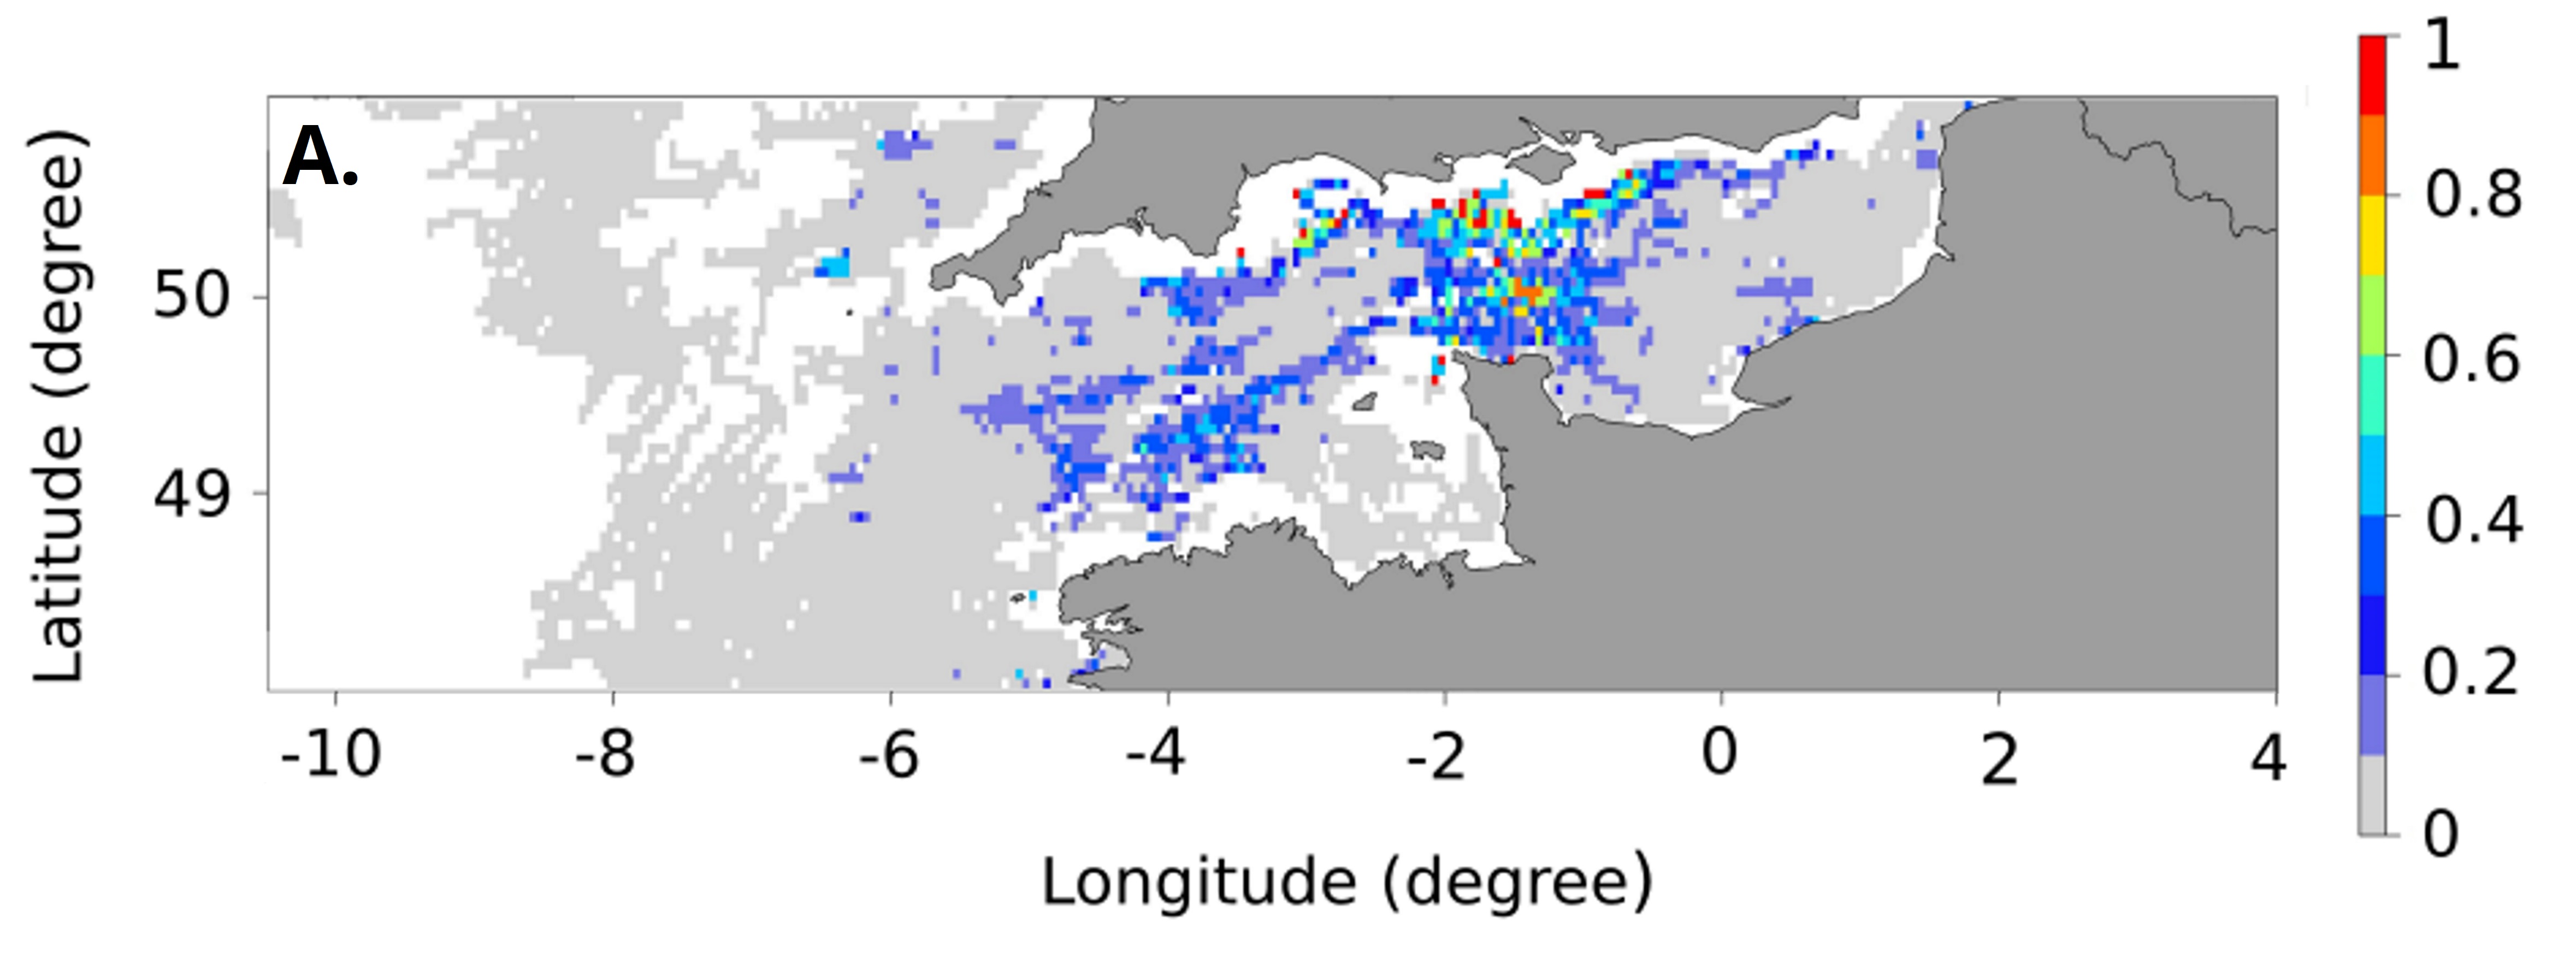
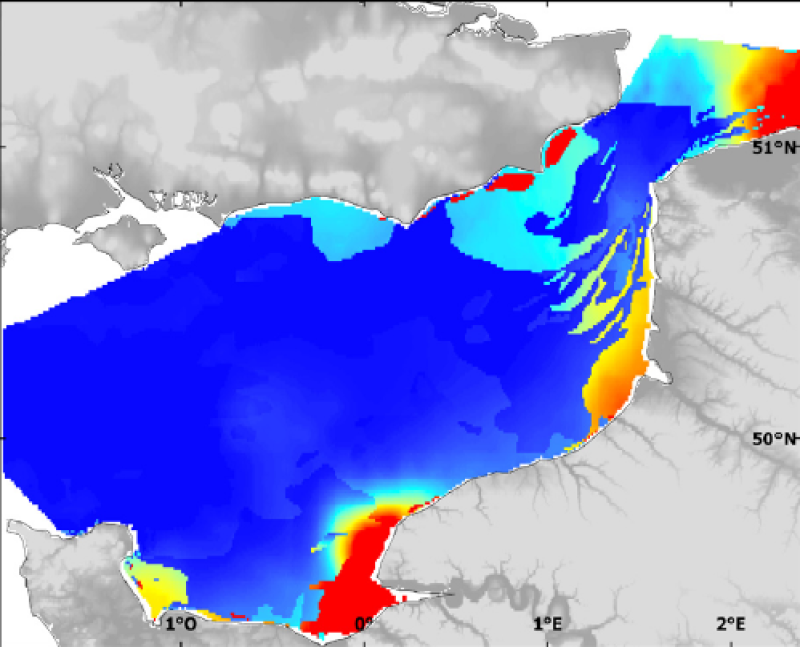
Abundances were recoded in term of presence-absence. Geostatistical interpolation : the spatial variation of biological data were analysed using GENSTAT (GENSTAT 7 Committee, 2004), which is a GENeral STATistics package including the main geostatistical tools. It computes experimentala variograms, fits these with various authorised mathematical models and uses them to calculate kriged estimates on a fine regular grid (of latitudes and longitudes). The grid of points was imported into ArcMap and interpolated with the Spatial Analyst extension in order to create a continuous raster of 1 km² resolution. The resulting maps illustrate the spatial distributions and the variations over time for biological data studied in CHARM's area. For legends of maps, approximates of the 5th and the 95th quantiles were used for the minimales and maximales values respectively.
-
Modelised abundance of species or prediction uncertainty.