 Mon GéoSource
1000
Type of resources
Available actions
Topics
INSPIRE themes
Keywords
Contact for the resource
Provided by
Years
Formats
Representation types
Update frequencies
status
Scale
Resolution
-
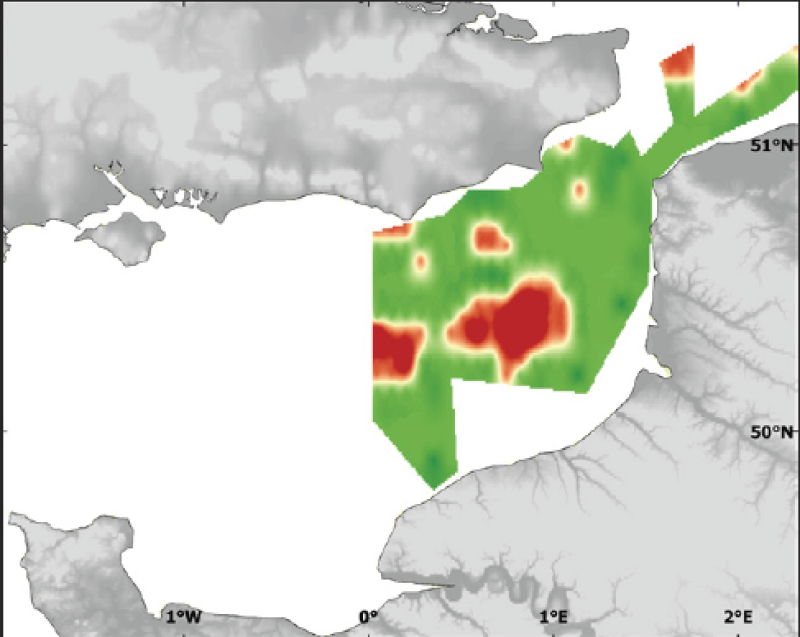
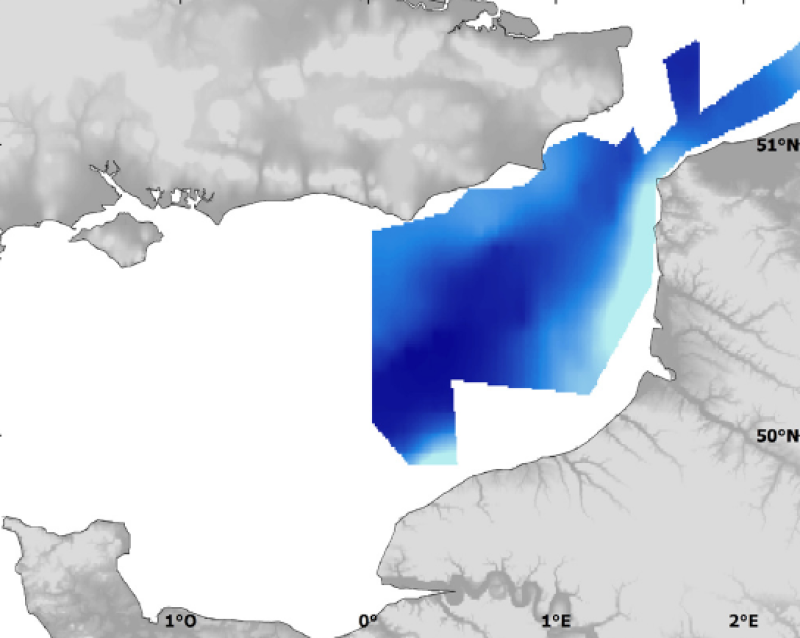
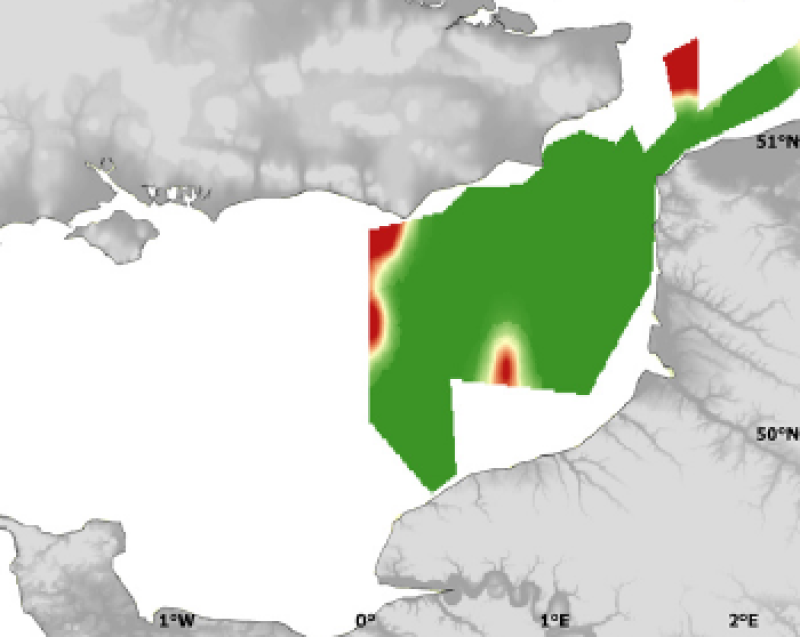
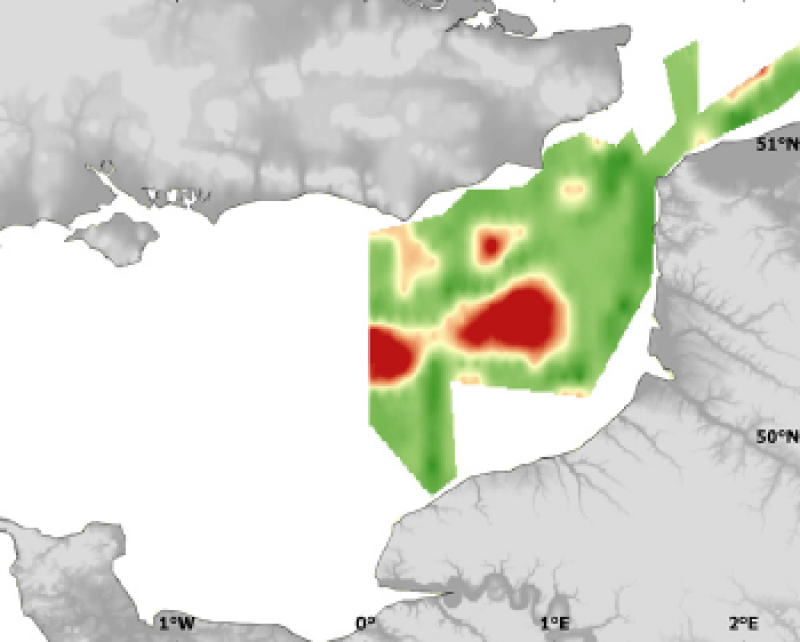
Biological data have been expressed in abundance (number of individuals per 20 m3). Kriging error (v) resulting from the interpolation of these data was maped.
-
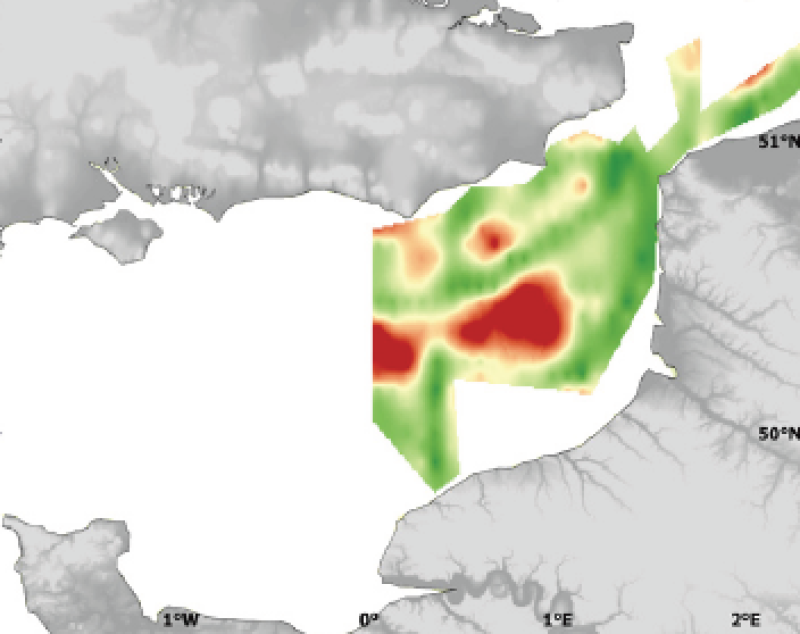
Modelised adundance of several species eggs or prediction uncertainty.
-
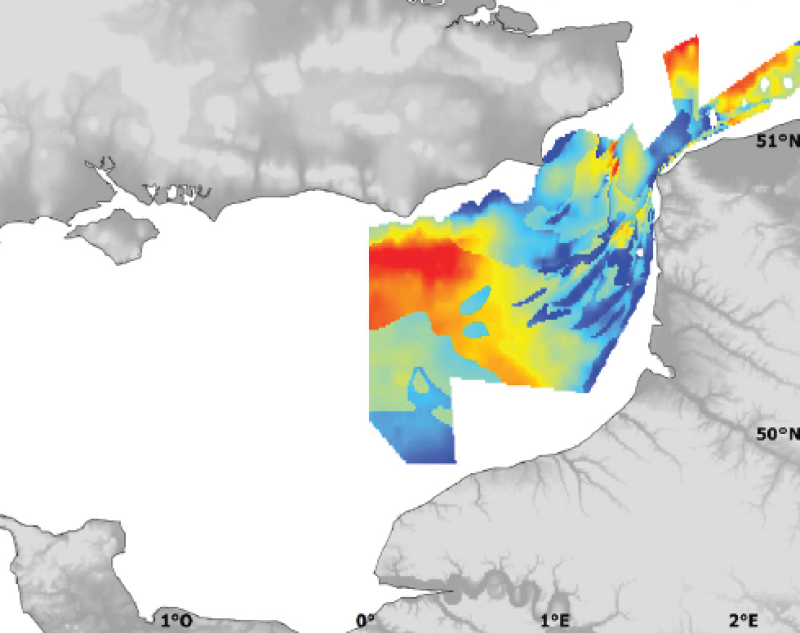
Modelised adundance of several species eggs or prediction uncertainty.
-
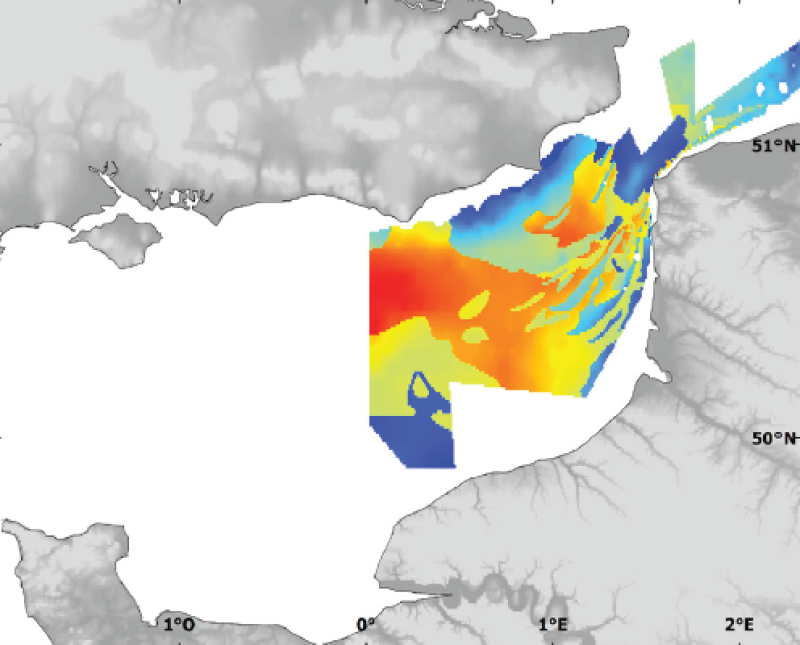
Modelised adundance of several species eggs or prediction uncertainty.
-
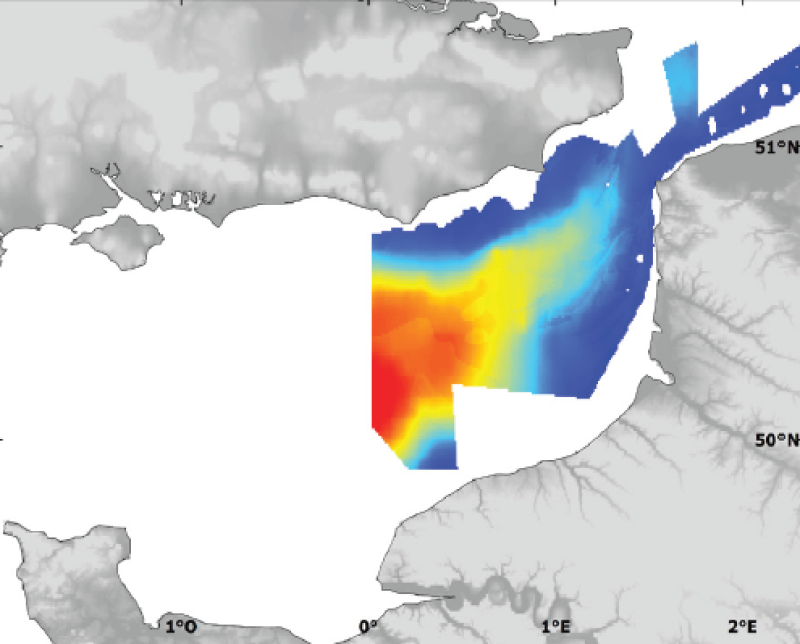
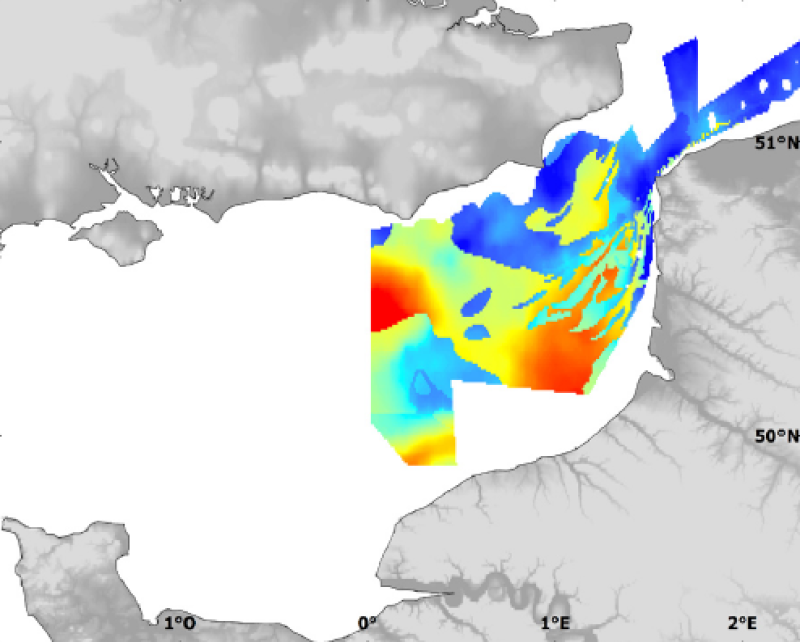
Modelised adundance of several species eggs or prediction uncertainty.
-
Three environmental parameters were measured in situ during the IBTS in 2007. Temperature and salinity were measured using thermosalinometer 3 to 5 m under sea surface. Sub-surface (3-5 m) chlorophyll a concentration was measured using a fluorometer (measure the fluorescence emitted by the pigment). The IBTS survey, which takes place each year in January, gives a good illustration of winter conditions.
-
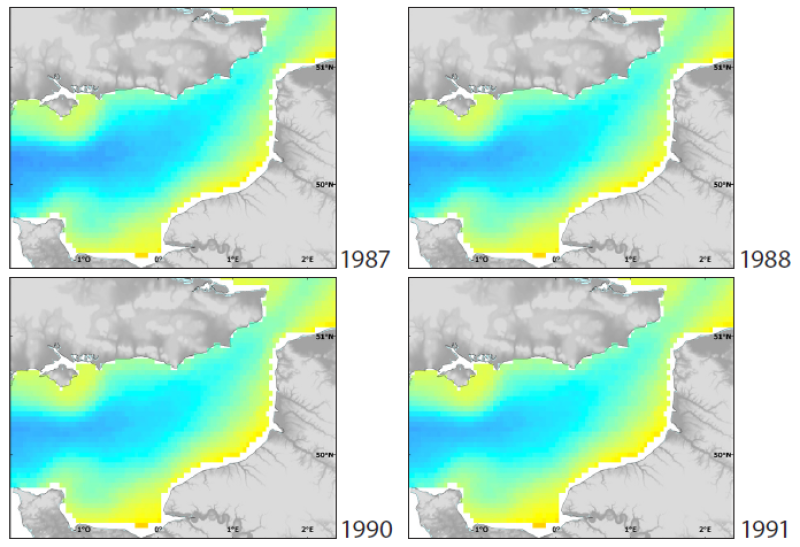
The English Channel is a biogeographical transition zone, situated between warm temperate and boreal marine province. This status enables the early detection of trends in the oceanic climate regime between two provinces. Mean SST maps for February (coldest month of the year) and August (warmest month of the year), from 1986 to 2006, were produced.
-
Biological data have been expressed in abundance (number of individuals per 20 m3). Kriging error (v) resulting from the interpolation of these data was maped.
-
Three environmental parameters were measured in situ during the IBTS in 2007. Temperature and salinity were measured using thermosalinometer 3 to 5 m under sea surface. Sub-surface (3-5 m) chlorophyll a concentration was measured using a fluorometer (measure the fluorescence emitted by the pigment). The IBTS survey, which takes place each year in January, gives a good illustration of winter conditions.
-
Three environmental parameters were measured in situ during the IBTS in 2007. Temperature and salinity were measured using thermosalinometer 3 to 5 m under sea surface. Sub-surface (3-5 m) chlorophyll a concentration was measured using a fluorometer (measure the fluorescence emitted by the pigment). The IBTS survey, which takes place each year in January, gives a good illustration of winter conditions.