 Mon GéoSource
Environment data set
Type of resources
Available actions
Topics
INSPIRE themes
Keywords
Contact for the resource
Provided by
Representation types
Update frequencies
status
Scale
-
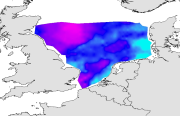
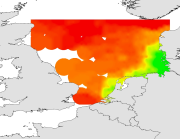
Temperature and salinity were measured, in situ at sea surface and at bottom during the IBTS surveys from 1980 to 2010 . Temperature and salinity were measured using CTD probe. The IBTS survey, which takes place each year in January, gives a good illustration of winter conditions.
-
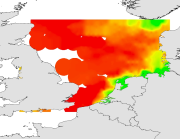
Temperature and salinity were measured, in situ at sea surface and at bottom during the iBTS surveys from 1991 to 2009 . Temperature and salinity were measured using CTD probe. The IBTS Q3 survey gives a good illustration of summer conditions.
-
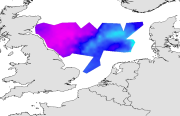
Temperature and salinity were measured, in situ at sea surface and at bottom during the IBTS surveys from 1980 to 2010 . Temperature and salinity were measured using CTD probe. The IBTS survey, which takes place each year in January, gives a good illustration of winter conditions.
-
Temperature and salinity were measured, in situ at sea surface and at bottom during the IBTS surveys from 1980 to 2010 . Temperature and salinity were measured using CTD probe. The IBTS survey, which takes place each year in January, gives a good illustration of winter conditions.
-
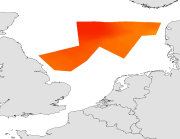
Temperature and salinity were measured, in situ at sea surface and at bottom during the iBTS surveys from 1991 to 2009 . Temperature and salinity were measured using CTD probe. The IBTS Q3 survey gives a good illustration of summer conditions.