 Mon GéoSource
IFREMER
Type of resources
Available actions
Topics
INSPIRE themes
Keywords
Contact for the resource
Provided by
Years
Formats
Representation types
Update frequencies
status
Scale
Resolution
-
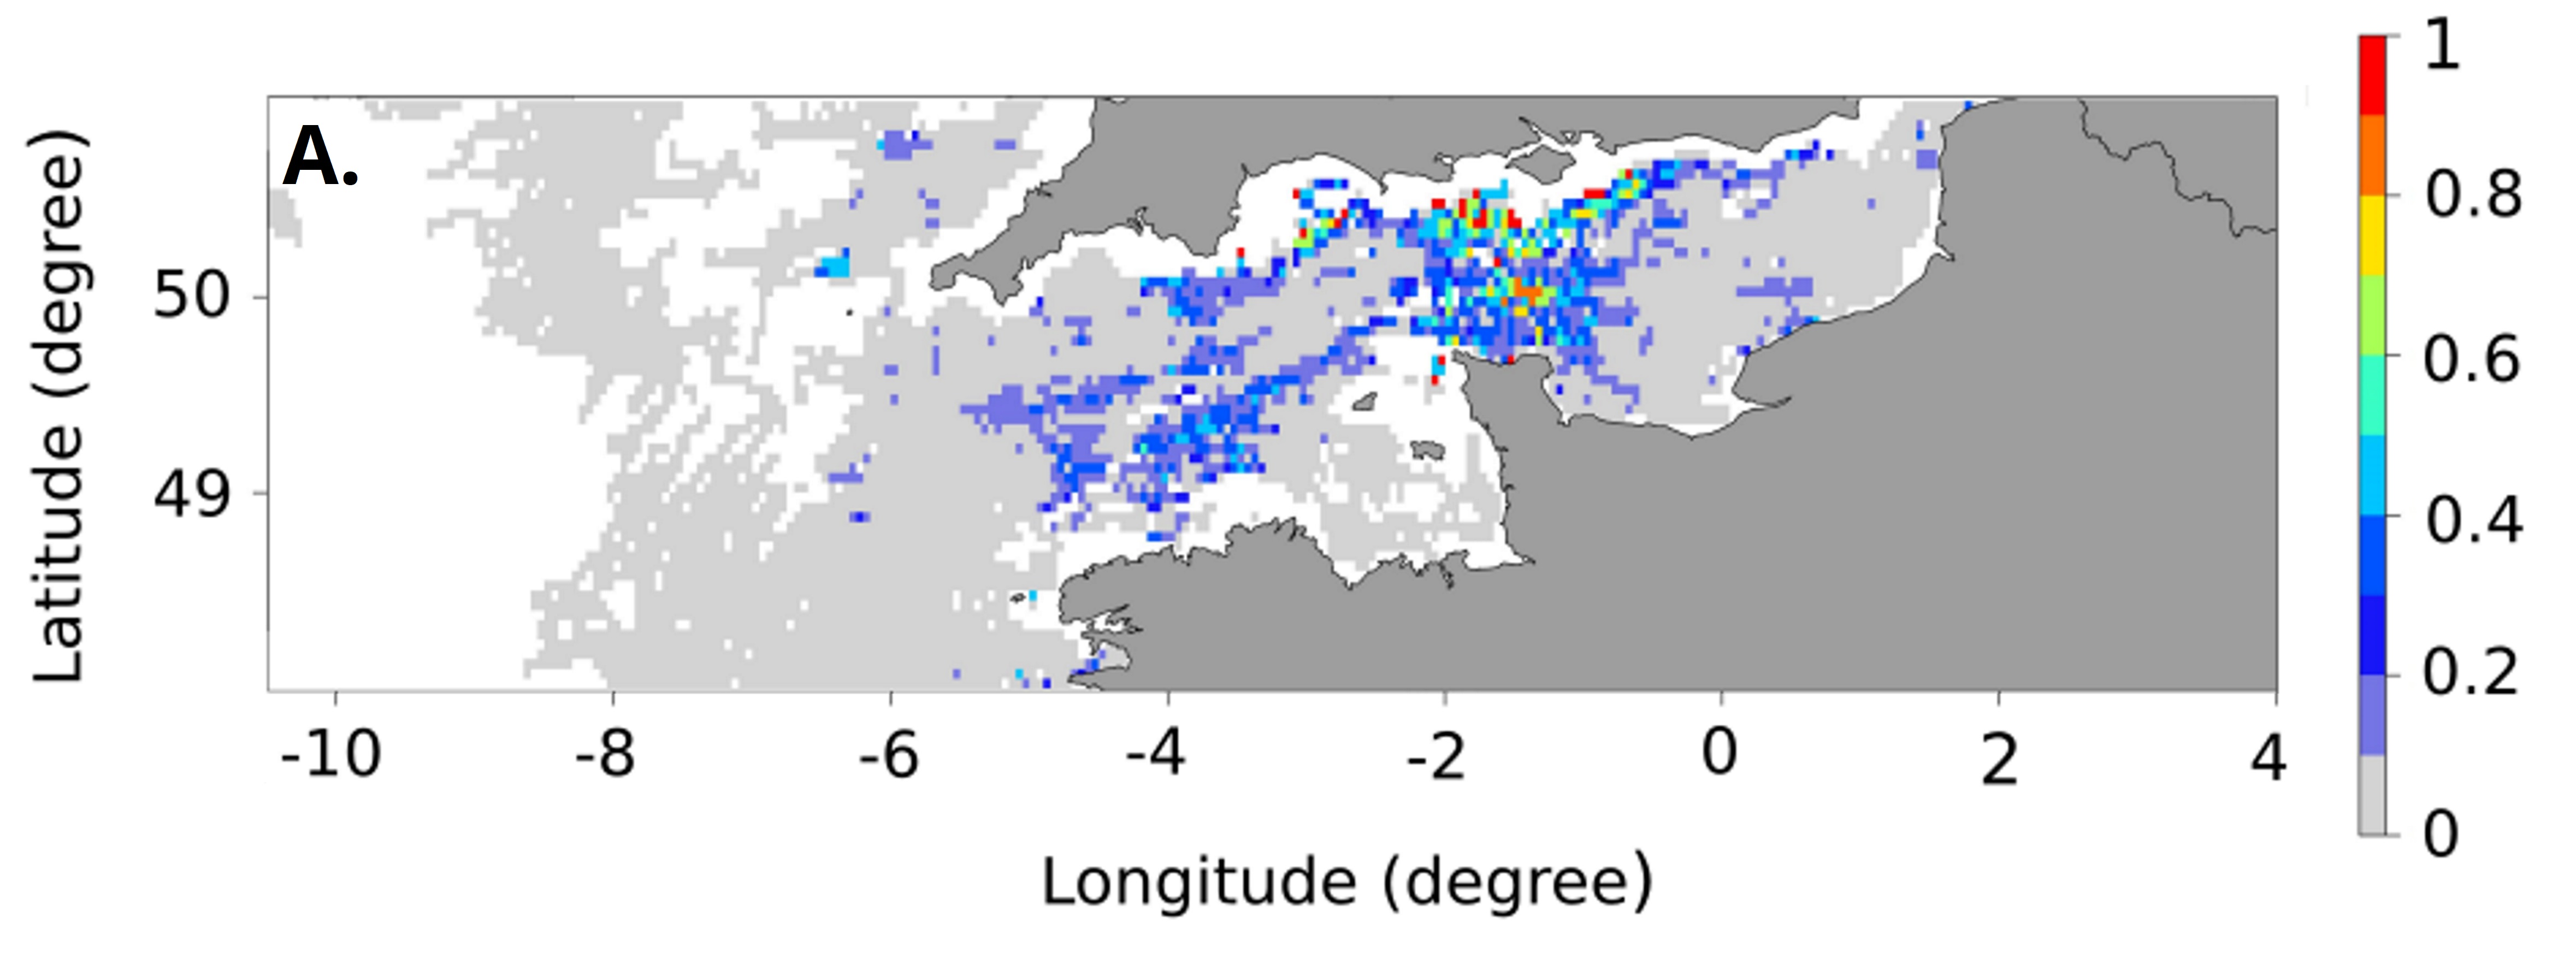
These maps represent the monthly probability of being a seabass spawning area for each month of the spawning season (January to April), and the mean probability of being a seabass spawning area over all spawning months in the English Channel - Celtic Sea. These probability maps were calculated by performing a geostatistical analysis of fishing data from geolocated vessels, and have a spatial resolution of 3 by 3 nautical miles.
-
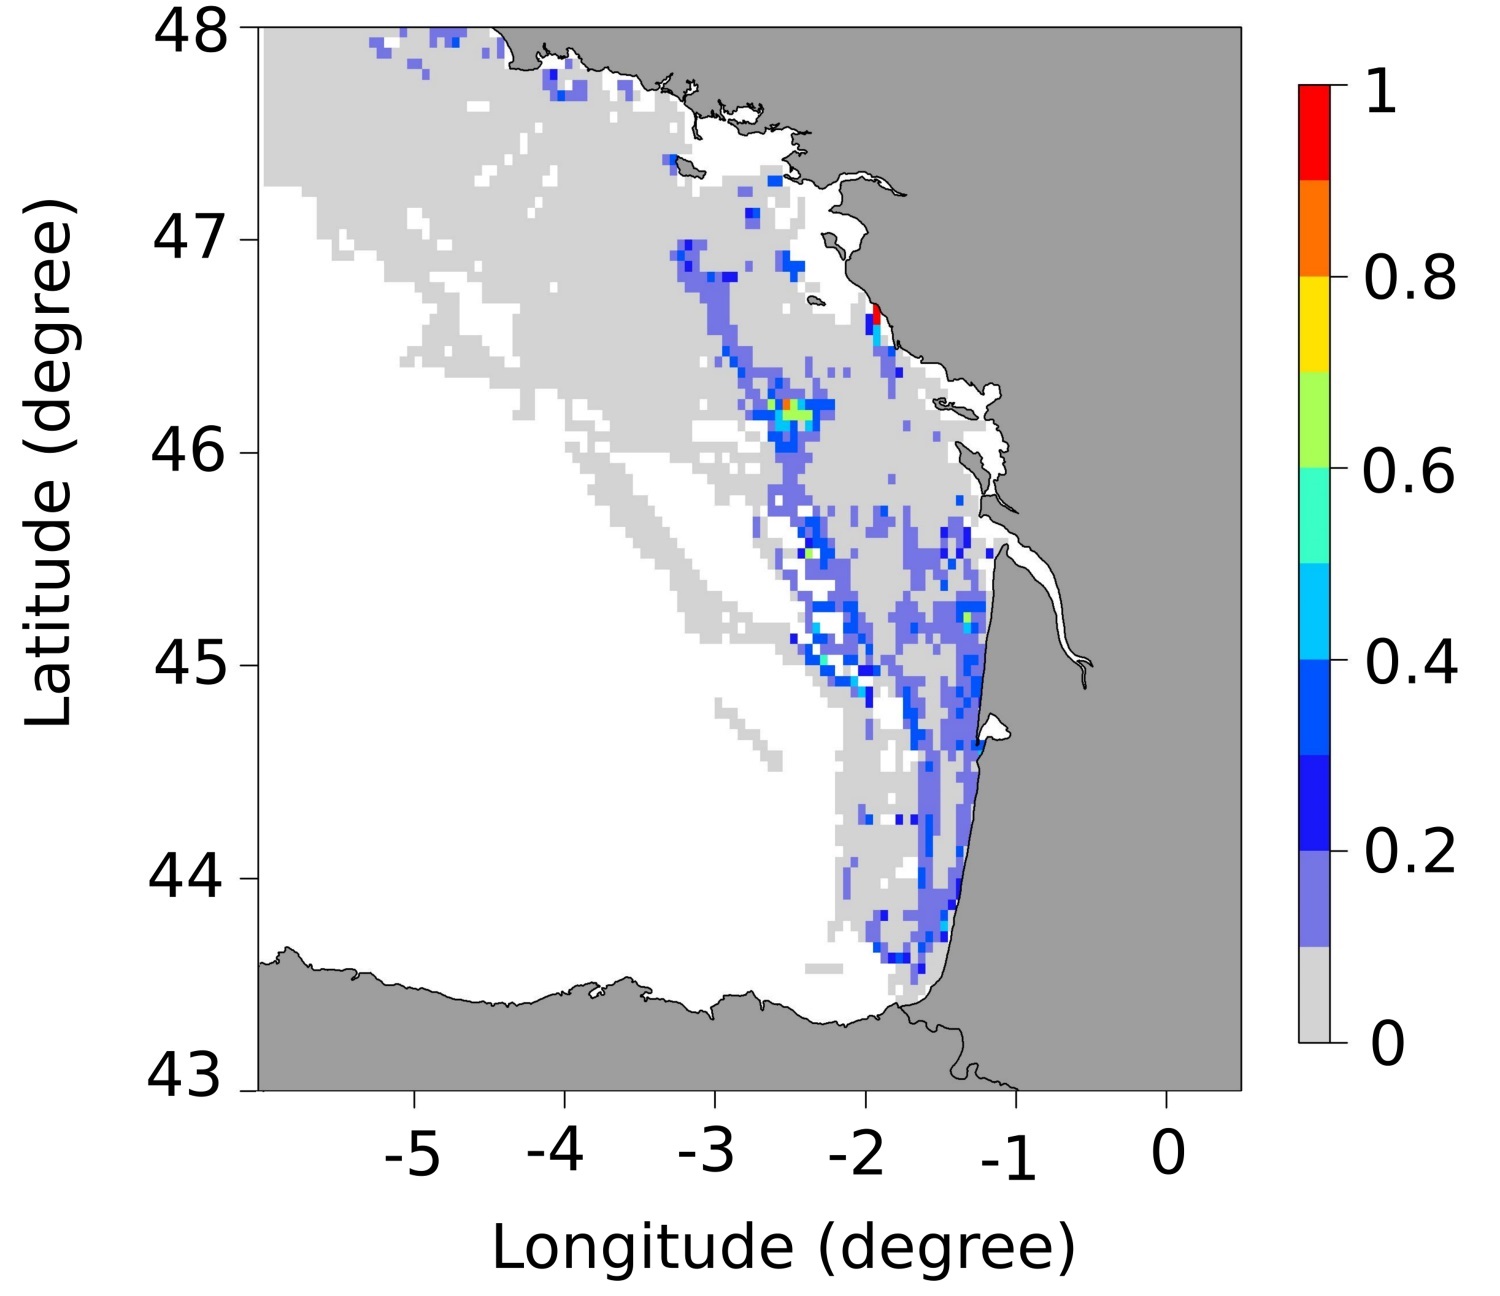
These maps represent the monthly probability of being a seabass spawning area for each month of the spawning season (January to March), and the mean probability of being a seabass spawning area over all spawning months in the Bay of Biscay. These probability maps were calculated by performing a geostatistical analysis of fishing data from geolocated vessels, and have a spatial resolution of 3 by 3 nautical miles.
-
Acoustic water column data acquired in 2009 during the MARMESONET marine expedition led to establish an accurate spatial distribution of gas emissions on the scale of the Sea of Marmara. The present database is composed of a surface shape file (.shp) dedicated to GIS applications. This seafloor surface represents the insonified area within which gas emissions occurred for more than 1 month of survey, from 4 November 2009 to 14 December 2009; as displayed in Figure 4 of Dupré et al. 2015 (Dupré S, Scalabrin C, Grall C, Augustin AH, Henry P, Sengör AMC, Görür N, Çagatay N, Géli L (2015) Tectonic and sedimentary controls for widespread gas emissions in the Sea of Marmara. Results from systematic, shipborne multibeam echosounder water column imageries. Journal of Geophysical Research 120 (5):2891-2912. doi:10.1002/2014JB011617). This publication investigated and discussed the relationship between fluid emissions at the seafloor with the fault network (active and inactive faults) and the sedimentary environment (nature, thickness and related-processes).
-
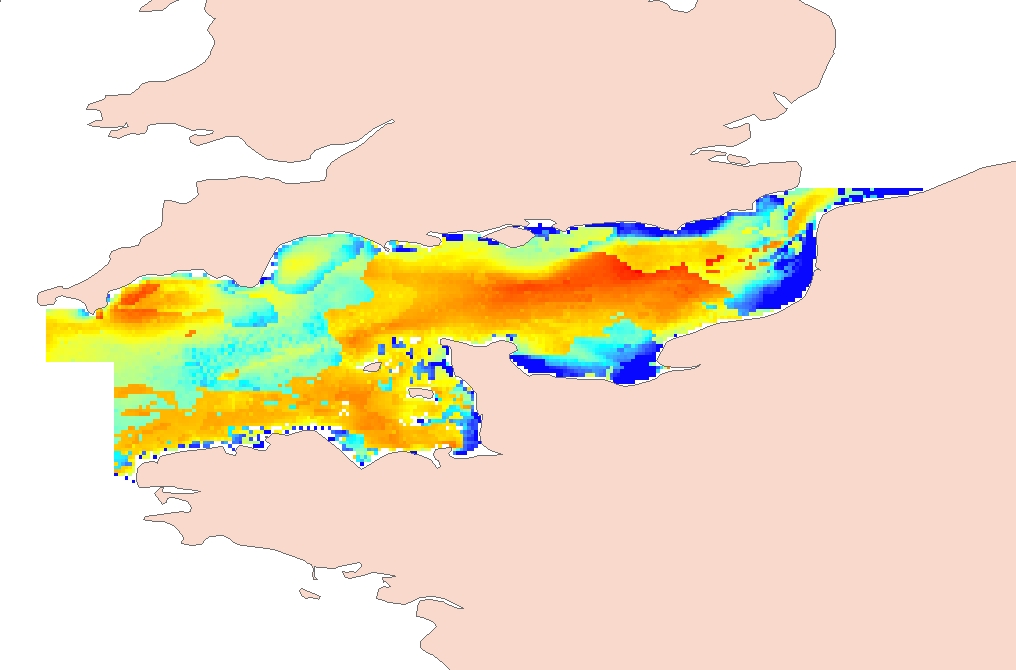
Process-driven seafloor habitat sensitivity (PDS) has been defined from the method developed by Kostylev and Hannah (2007), which takes into account physical disturbances and food availability as structuring factors for benthic communities. It is a conceptual model, relating species’ life history traits to environmental properties. Physical environment maps have been converted into a map of benthic habitat types, each supporting species communities with specific sensitivity to human pressures. It is based on two axes of selected environmental forces. The "Disturbance" (Dist) axis reflects the magnitude of change (destruction) of habitats (i.e. the stability through time of habitats), only due to natural processes influencing the seabed and which are responsible for the selection of life history traits. The "Scope for Growth" (SfG) axis takes into account environmental stresses inducing a physiological cost to organisms and limiting their growth and reproduction potential. This axis estimates the remaining energy available for growth and reproduction of a species (the energy spent on adapting itself to the environment being already taken into account). It can be related to the metabolic theory of the ecology. The process-driven sensitivity (PDS) can be seen as a risk map that combines the two previous axes and reflects the main ecological characteristics of the benthic habitats regarding natural processes. Areas with low disturbance are areas with a naturally low reworking of the sediment, allowing the establishment of a rich sessile epifauna community, with K-strategy species. Areas with low SfG means that the environmental factors, even though there are not limiting, are in lower values, i.e. that it imposes a cost for species to live. In areas combining low disturbance and low SfG, big suspension-feeder species with long life and slow growth can often be found: these species are more vulnerable in case of added disturbance. Details may be found in Foveau A, Vaz S, Desroy N, Kostylev VE (2017) Process-driven and biological characterisation and mapping of seabed habitats sensitive to trawling. PLoS ONE 12(10): e0184486. https://doi.org/10.1371/journal.pone.0184486
-
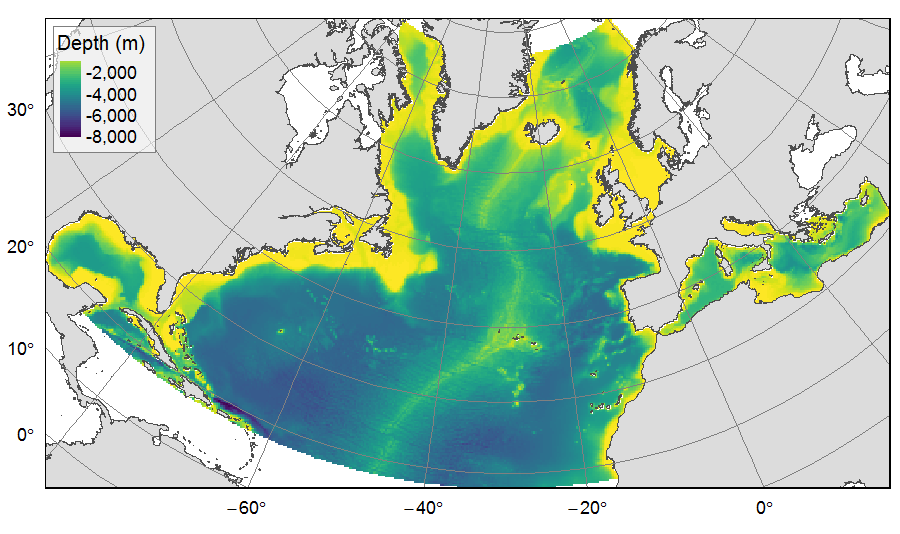
Distribution of three bathymetric terrain variables (depth, slope and Bathymetric Position Index) on the North Atlantic (18°N to 76°N and 36°E to 98°W). This dataset originated from three source layers (3km * 3km resolution) computed within the work package 3 of EU ATLAS project, and based on the EMODnet Digital Bathymetry portal and the General Bathymetric Chart of the Oceans (GEBCO). From these source layers, the mean depth (m), slope (degree) and BPI (no unit) were calculated for each 25km * 25km gridsquare. This dataset was built to feed a basin-wide spatial conservation planning exercise, targeting the deep sea of the North Atlantic. The goal of this approach was to identify conservation priority areas for Vulnerable Marine Ecosystems (VMEs) and deep fish species, based on the distribution of species and habitats, human activities and current spatial management.
-
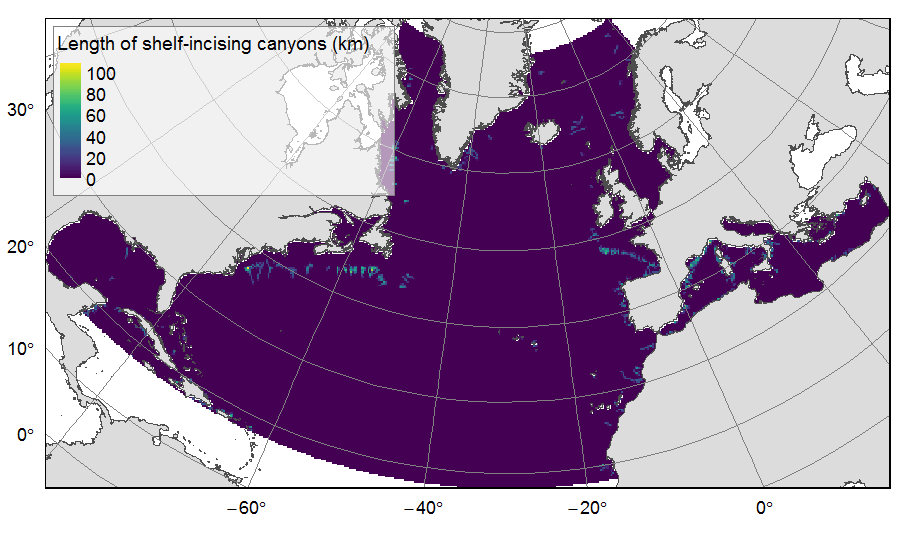
Distribution of three geomorphologic features (fracture zones, canyons, and seamounts) on the North Atlantic (18°N to 76°N and 36°E to 98°W). Source vector data originated from the GEBCO Gazetteer of Undersea Features Names for fractures, Harris & Whiteway (2011) for canyons, and Yesson et al. (2011) for seamounts. The presence (value=1) of fracture zones or seamounts and the total length of canyons (in km, independently for shelf-incising or blind canyons) was extracted in 25km * 25km gridsquares. This dataset was built to feed a basin-wide spatial conservation planning exercise, targeting the deep sea of the North Atlantic. The goal of this approach was to identify conservation priority areas for Vulnerable Marine Ecosystems (VMEs) and deep fish species, based on the distribution of species and habitats, human activities and current spatial management.
-
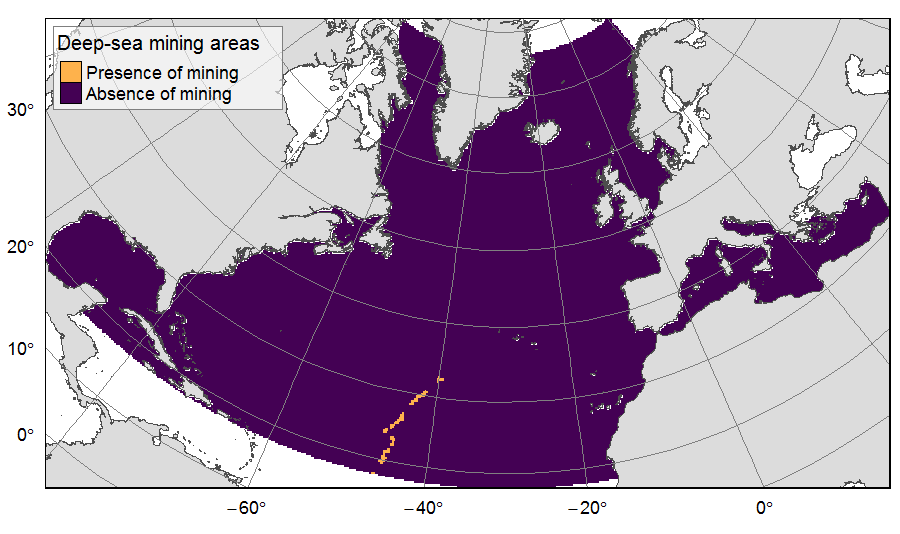
Presence of deep-sea mining exploration zones on the North Atlantic (18°N to 76°N and 36°E to 98°W). These areas correspond to the three polymetallic sulphides exploration contracts on the Mid-Atlantic Ridge, attributed to Poland, France and Russia. Each of the three contract areas is divided into 100 squares of 10km by 10km. Source polygons originated from the International Seabed Authority. The presence (value=1) of deep-sea mining was extracted in 25km * 25km gridsquares. This dataset was built to feed a basin-wide spatial conservation planning exercise, targeting the deep sea of the North Atlantic. The goal of this approach was to identify conservation priority areas for Vulnerable Marine Ecosystems (VMEs) and deep fish species, based on the distribution of species and habitats, human activities and current spatial management.
-
This dataset was built to feed a basin-wide spatial conservation planning exercise, targeting the deep sea of the North Atlantic, in the framework of the ATLAS H2020 project. This approach aimed to inform Marine Spatial Planning and conservation initiatives for the deep sea of the North Atlantic, by identifying conservation priority areas for the Vulnerable Marine Ecosystems (VMEs) and deep fish species and discussing the efficiency of the current spatial management context relatively to conservation stakes. This publication provides (1) the links to spatial datasets used as an input, (2) the R scripts used to run the final conservation scenarios together with associated table of targets and connectivity matrix, that can be run on the input data, and (3) the outputs of the final scenarios constructed and computed for ATLAS. Produced by IFREMER. This output reflects the authors’ views and the European Union is not responsible for any use that may be made of the information it contains. Please note that you use these data at your own risk. No warranty is expressed or implied and no liability is accepted for any inconveniences or damages that may ensue from their use.
-
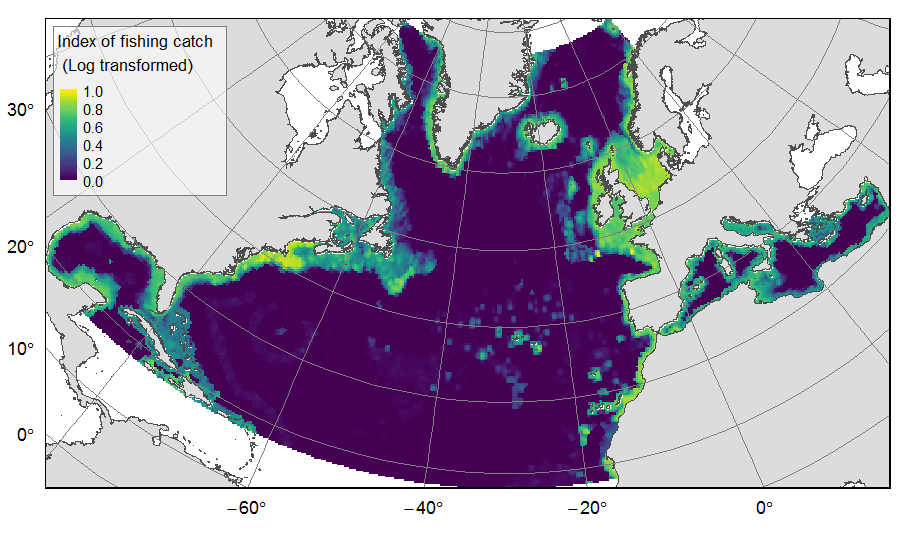
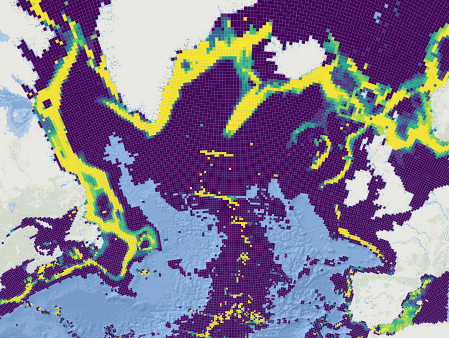
Distribution of catch from deep-sea impacting fishing on the North Atlantic (18°N to 76°N and 36°E to 98°W), for the period 2010-2015. The average of yearly fishing catch for the period 2010-2015 is displayed as an index on the ATLAS grid of 25km * 25km resolution. Source data originated from the Global Fisheries Landings V4.0 database. The dataset was filtered to select only the fishing gears that have an impact on large areas of the seafloor (dredges, bottom trawls, and Danish seines). Within each cell, all remaining catch records were summed to get the total catch rate of the considered year. This dataset was built to feed a basin-wide spatial conservation planning exercise, targeting the deep sea of the North Atlantic. The goal of this approach was to identify conservation priority areas for Vulnerable Marine Ecosystems (VMEs) and deep fish species, based on the distribution of species and habitats, human activities and current spatial management.
-
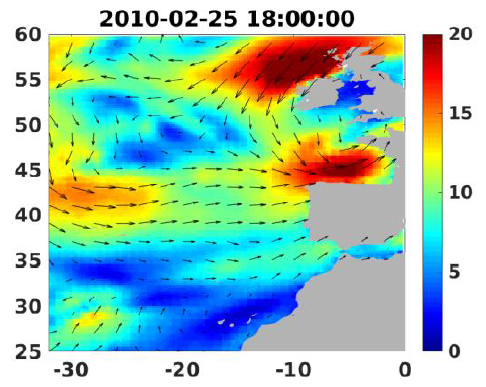
Wind analyses, estimated over the North Atlantic Ocean with a focus on some specific regions, are one the main ARCWIND (http://www.arcwind.eu/) project deliverables. They are estimated from various remotely sensed wind observations in combination with numerical model (WRF), with regular space (0.25deg in latitude and longitude), and time (00h:00, 06h:00, 12h:00, 18h:00 UTC), and based the method described in (Bentamy A., A. Mouche, A. Grouazel, A. Moujane, M. A. Ahmed. (2019): Using sentinel-1A SAR wind retrievals for enhancing scatterometer and radiometer regional wind analyses . International Journal Of Remote Sensing , 40(3), 1120-1147 . https://doi.org/10.1080/01431161.2018.1524174).