 Mon GéoSource
/Metropolitan France/Celtic Seas
Type of resources
Available actions
INSPIRE themes
Provided by
Years
Representation types
Update frequencies
status
Scale
Resolution
-
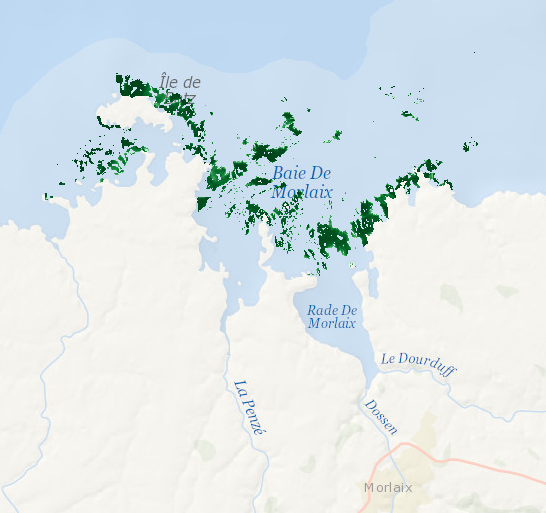
Data represents presence-absence prediction of kelp forest. Biological ground truth data were integrated with high resolution environmental datasets to develop statistical model that accurately predict the structure of Laminaria forests within the Bay of Morlaix. As a direct management output, high-resolution map (25 m2 grid) was produced.
-
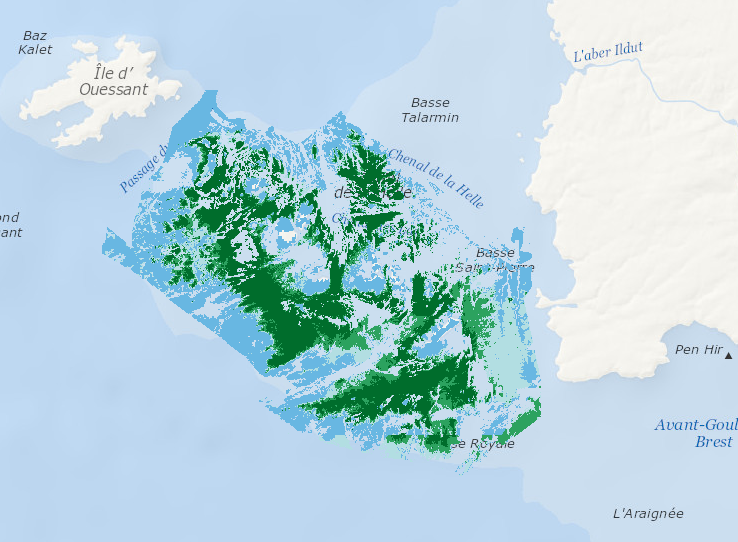
Data represents percentage cover of kelp forest as well as biomass of the 2 main species: L. digitata and L. hyperoborea. The used approach consists in firstly establishing surveys and appropriate processing methods in order to provide a detailed underwater topography of the area and to accurately delineate hard substrates (bedrock) potentially colonized by kelp. Secondly, a habitat suitability model is fitted for each species on some carefully selected field stations, measuring kelp presence/absence and biomass. Predictive maps are produced, based on hard substrate areas previously delineated.
-
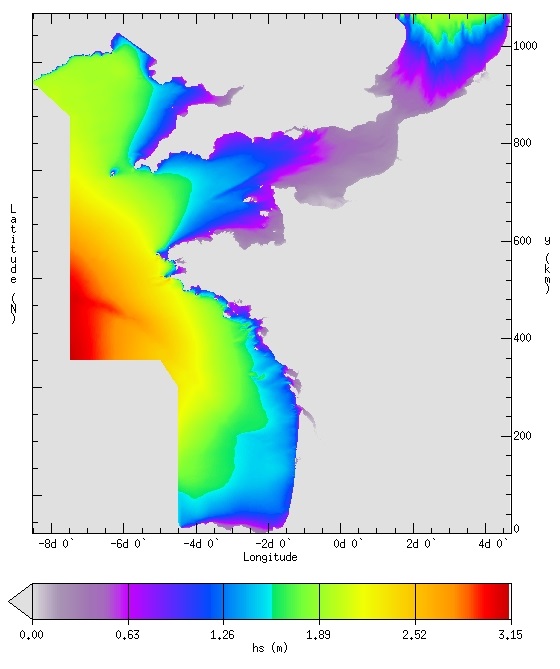
IOWAGA sea-states hindcast database generated by the wave model WAVEWATCH-III and forced by ECMWF winds on the French coast of the Atlantic ocean unstructured grid over 2008-2018 period.
-
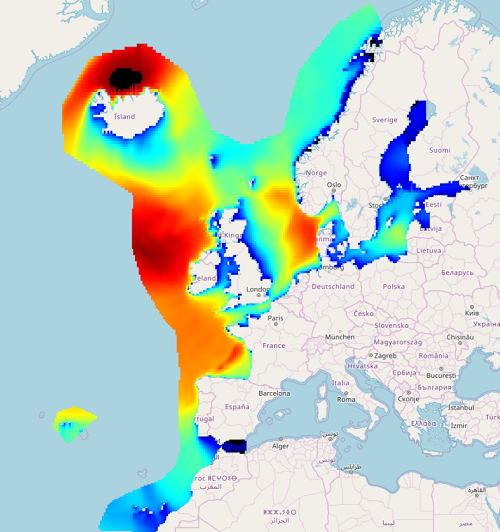
IOWAGA sea-states hindcast database generated by the wave model WAVEWATCH-III and forced by ECMWF winds on the North East Atlantic grid over 1990-2012 period.
-
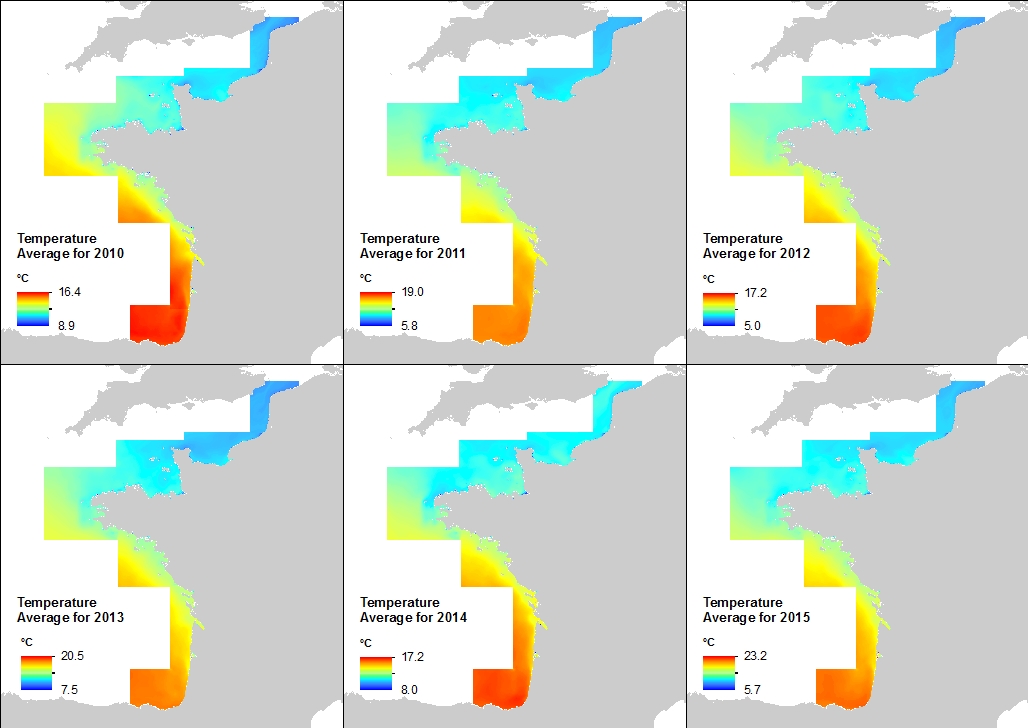
Cette climatologie à la résolution spatiale de 500 mètres a été établie à partir des archives de série temporelles issues du rejeu hydrodynamique réalisée avec le modèle MARS 3D et la librairie AGRIF le long de la façade atlantique française. La variable mise à disposition est la température.Les valeurs sont exprimées en degrés Celsius. La valeur de chaque pixel est une moyenne des valeurs des 40 niveaux verticaux pris en compte par le modèle.
-

Cette climatologie à la résolution spatiale de 500 mètres a été établie à partir des archives de série temporelles issues du rejeu hydrodynamique réalisée avec le modèle MARS 3D et la librairie AGRIF le long de la façade atlantique française. La variable mise à disposition est la Salinité. Les valeurs sont exprimées en psu. Le niveau vertical considéré est la surface de l'océan.
-
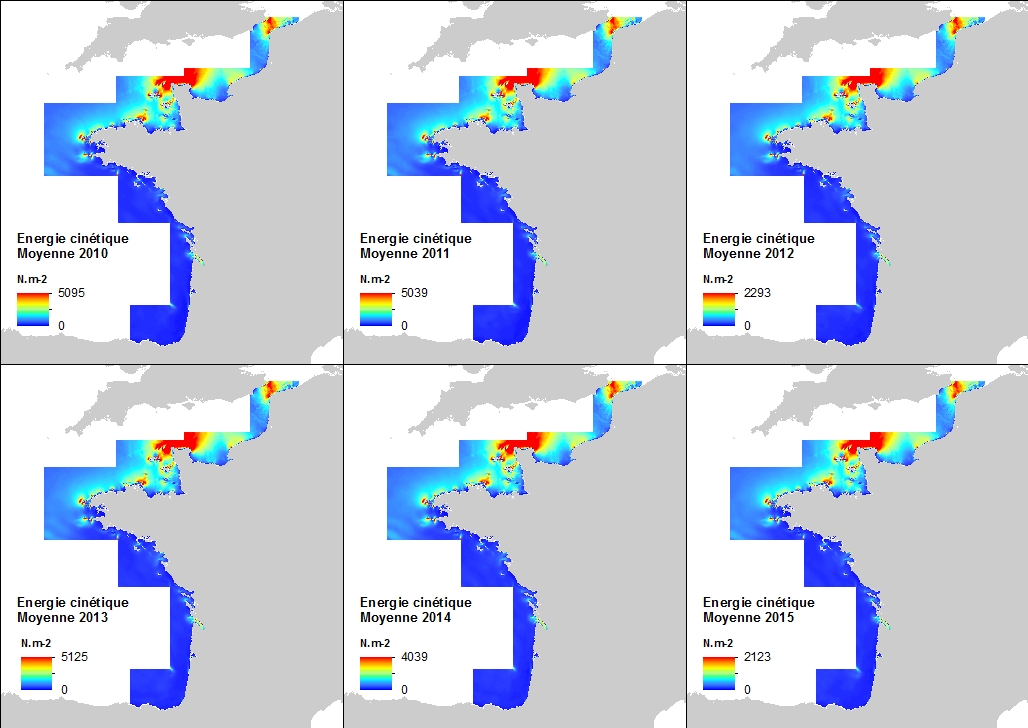
Cette climatologie à la résolution spatiale de 500 mètres a été établie à partir des archives de série temporelles issues du rejeu hydrodynamique réalisée avec le modèle MARS 3D et la librairie AGRIF le long de la façade atlantique française. La variable mise à disposition est l'énergie cinétique induite par les courants marins résultant de la marée, des différences de densité, et de l'action des vents. La formule mathématique utilisée pour l'énergie cinétique est 0.5mv², m étant la masse volumique de l'eau de mer (1027 kg.m-3) et v la vitesse des courants.Les valeurs sont exprimées en N.m-2 (Newton par mètre carré). Le niveau vertical considéré est le fond de l'océan.
-
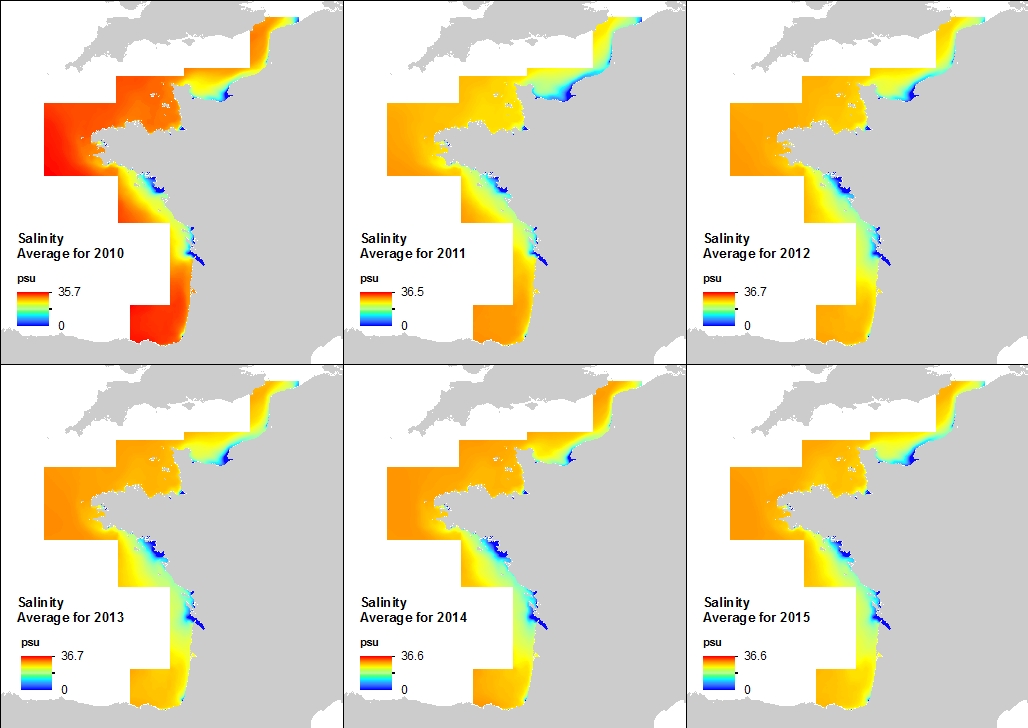
Cette climatologie à la résolution spatiale de 500 mètres a été établie à partir des archives de série temporelles issues du rejeu hydrodynamique réalisée avec le modèle MARS 3D et la librairie AGRIF le long de la façade atlantique française. La variable mise à disposition est la salinité. Les valeurs sont exprimées en psu. Le niveau vertical considéré est le fond de l'océan.
-
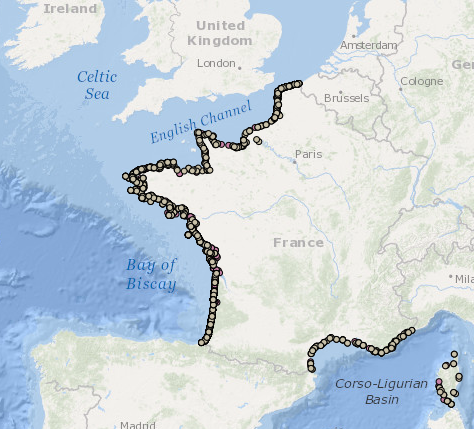
Données d’occurrence des échouages de mammifères marins collectées par les correspondants du Réseau National Echouages (date, position, espèce) en métropole en 2014-2020. cd_nom: code de l'espèce observée selon taxref lb_nom: nom latin de l'espèce observée selon taxref nom_commun: nom commun de l'espèce observée selon taxref date_obs: jj/mm/aaaa, date de l'observation de l'animal échoué com_codes_insee: code de la commune de l'échouage selon l'INSEE com_nom: nom de la commune selon l'INSEE com_coord_lat: y en degrés décimaux de la commune de l'échouage com_coord_long: x en degrés décimaux de la commune de l'échouage id_mammifere: référence de l'animal dans la base de données Pelagis identiteObservateur: nom du correspondant ayant effectué l'observation organismeObservateur: organisme du correspondant ayant effectué l'observation organismeGestionnaireDonnees: organisme assurant la gestion de la base de données
-

Le projet NourDem vise à réaliser des campagnes annuelles de chalutage dans les trois estuaires de la Seine, de la Loire et de la Gironde.