 Mon GéoSource
ressource halieutique
Type of resources
Available actions
Topics
INSPIRE themes
Keywords
Contact for the resource
Provided by
Representation types
Update frequencies
status
Scale
-
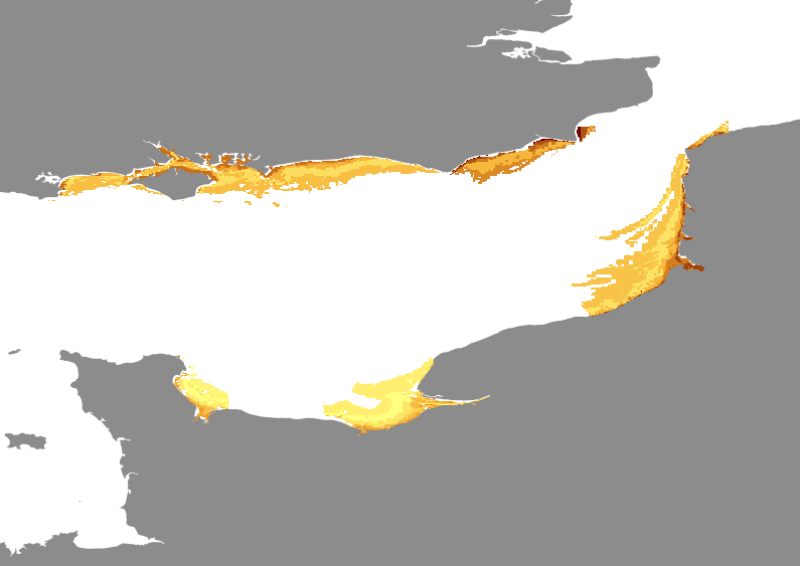
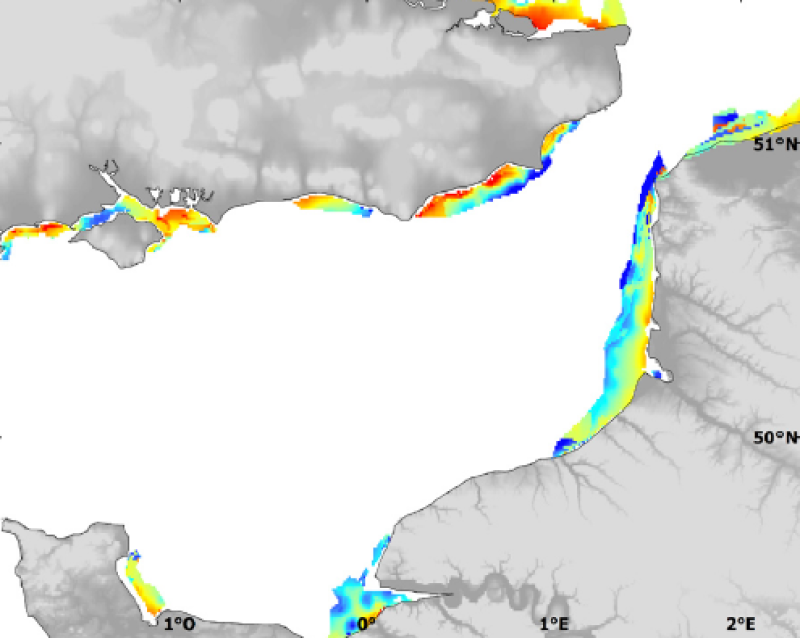
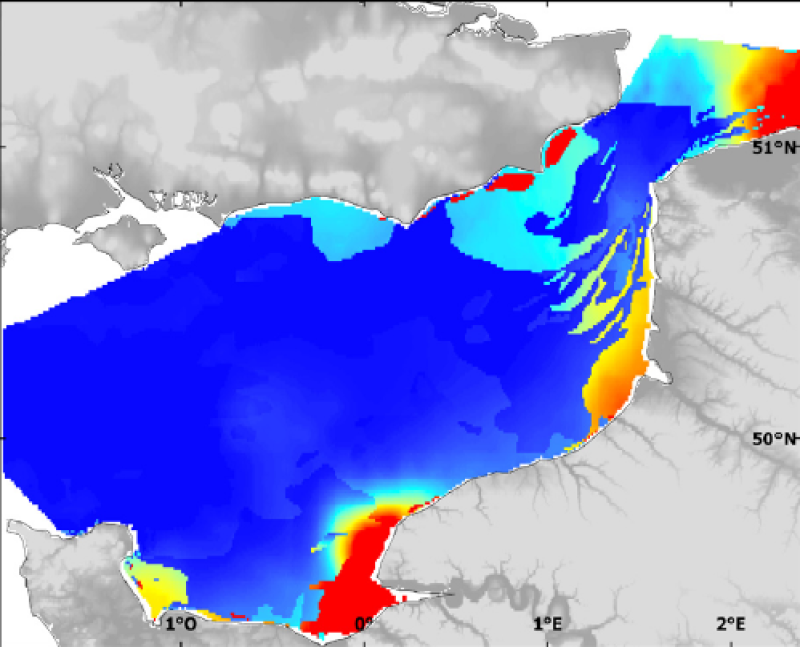
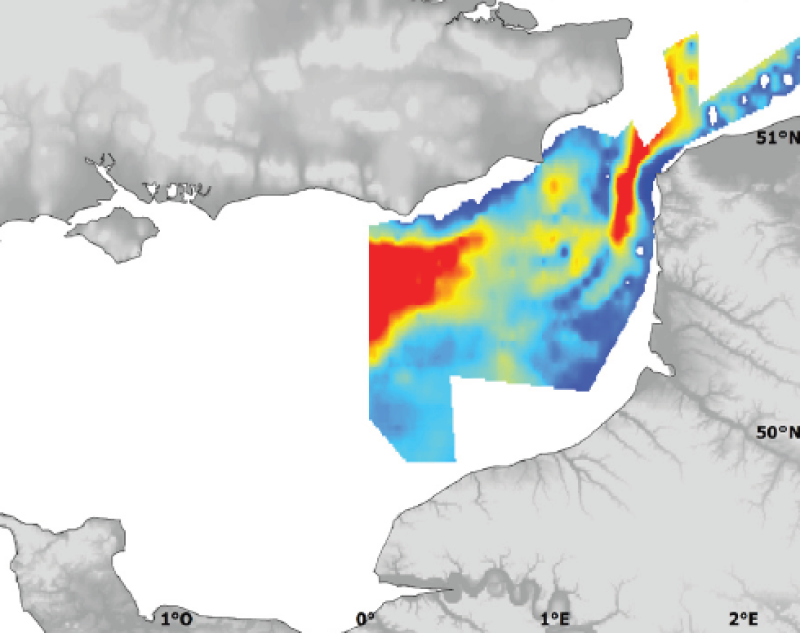
Modelised abundances of Solea solea in coastal nurseries.
-
Modelised abundance of species or prediction uncertainty.
-
-
Biologic data have been expressed in abundance (numbers or density values (nbr/km²)) and always required to be log-transformed using a log10(x+1) transformation.
-
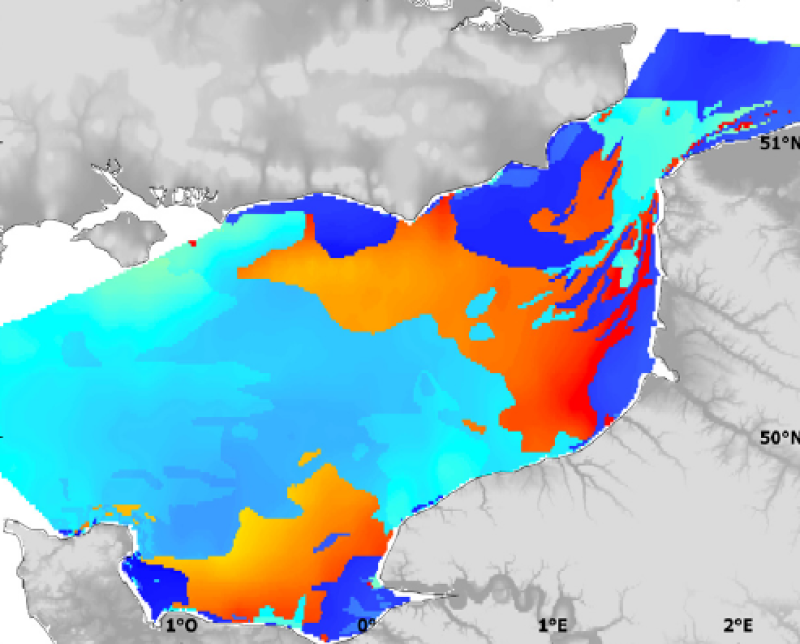
Three environmental parameters were measured in situ during the REISE2 survey in April 1995. Temperature and salinity were measured using a probe. Fluorescence (mean for the water column) was measured using a fluorometer. This survey gives illustration of spring conditions.
-
Modelised abundances of several species in coastal nurseries or prediction uncertainty.
-

Biological data have been expressed in abundance (number of individuals per 20 m3).
-
Modelised abundance of species or prediction uncertainty.
-
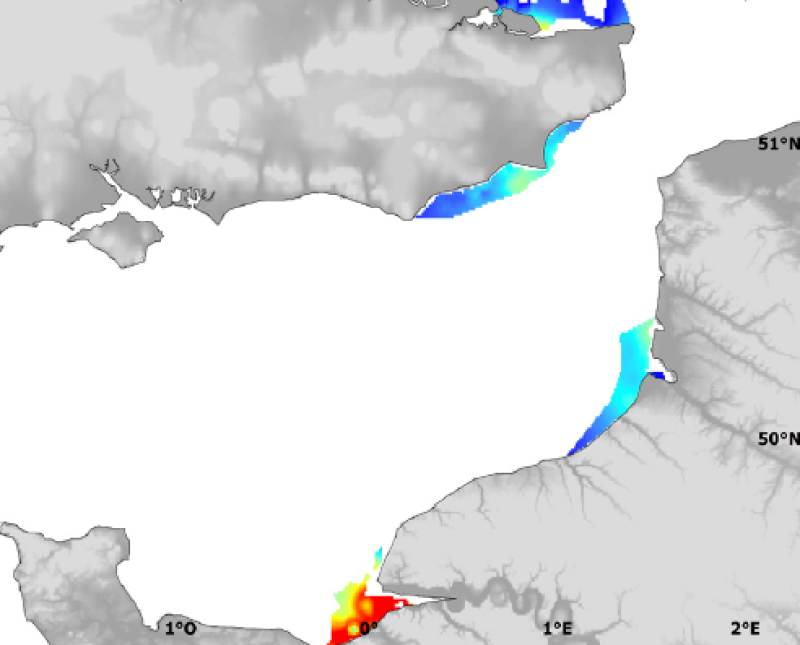
Temperature and salinity were measured, in situ at sea surface and at bottom during the IBTS surveys from 1980 to 2010 . Temperature and salinity were measured using CTD probe. The IBTS survey, which takes place each year in January, gives a good illustration of winter conditions.
-
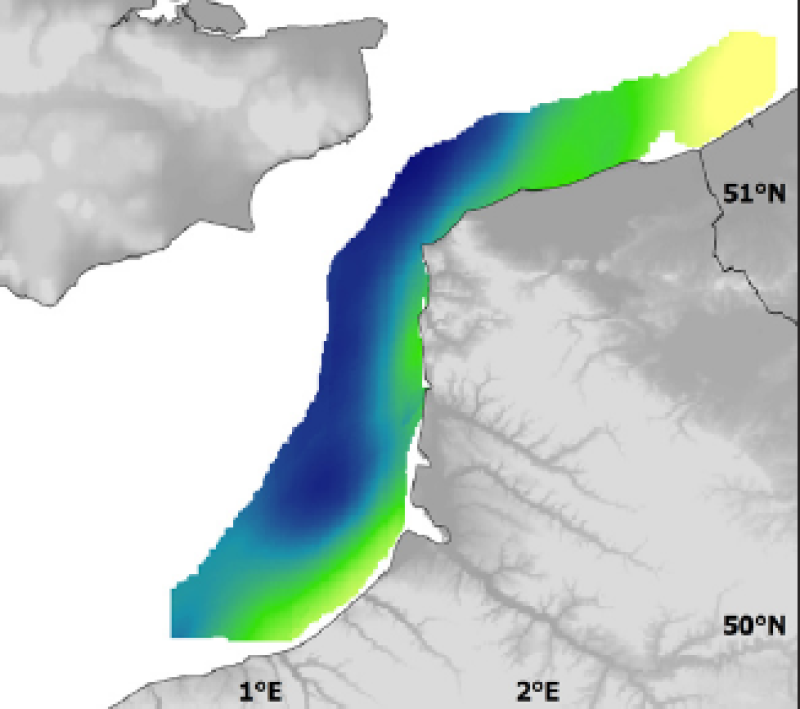
Modelised adundance of several species eggs or prediction uncertainty.