 Mon GéoSource
Oceans
Type of resources
Available actions
INSPIRE themes
Provided by
Years
Representation types
Update frequencies
status
Scale
Resolution
-
La donnée associée met en évidence l'effort d'observation réalisé lors de la campagne d'acquisition de données d'Observation sur plateforme aérienne SAMM2 (Suivi aérien de la Mégafaune Marine) réalisée par l'Observatoire PELAGIS. L'effort d'observation est matérialisé sous la forme d'un linéaire calqué sur les transects prévus. Description de la table attributaire : region char 30 Zone d'étude platform char 10 Plateforme d'observation : ovipa/ovibat survey char 15 Nom de la campagne computer char 5 Identifiant du système sur lequel le vol est effectué sector char 10 Secteur d'échantillonnage strate char 5 Strate d'échantillonnage transectN char 10 Transect d'échantillonnage crossNb int Nombre de passage sur le transectN effortGrp char 20 Numéro du groupe d'effort leg char 70 Numéro d'effort txt leg_id int Numéro d'effort (pour un LEG uniquement) left char 5 Arrière gauche (position gauche sur une plate-forme simple) right char 5 Arrière droit (position droite sur une plate-forme simple) navigator char 5 Navigateur (position centrale) beginTime char 20 Temps auquel a été commencé le parcours endTime char 20 Temps auquel s'est terminé le parcours status char 5 Status du parcours seaState char 5 Code pour l'état de la mer selon l'échelle de Beaufort cloudCover char 5 Couverture nuaugeuse défini par le système des octats (0 pour dégagé < 8 pour complètement couvert) glareFrom char 5 Début de la zone d'éblouissement en degré (le nez de l'avion 0°) glareTo char 5 Fin de la zone d'éblouissement en degré (le nez de l'avion 0°) glareSeverity char 5 ntensité d'éblouissement (0 aucun éblouissement < 3 éblouissement fort) turbidity char 5 Turbidité/transparence de l'eau (0 eau claire < 2 eau turbide, 9 turbidité inconnue) subjective char 20 Détectabilité. Estimation des observateurs en fonction des autres paramètres si les conditions sont bonnes ou non. Il s'agit de deux lettres, une pour le côté gauche et une pour le côté droit. (E excellentes, G bonnes, M moyennes et P pauvres). comment char 400 Commentaires sur le parcours lat double Latitude géographique en degré décimal du début du parcours lon double Longitude géographique en degré décimal du début du parcours latEnd double Latitude géographique en degré décimal de la fin du parcours lonEnd double Longitude géographique en degré décimal de la fin du parcours lengthKm double Longueur de l'effort en km engin char 30 Immatriculation de l'avion utilisé pour le vol speed int Vitesse (km/h) lors de la capture altitude char 15 Altitude (feet) lors de la capture coordN char 15 Code EPSG du système de coordonnées dans lequel les valeurs de distance ont été calculées
-
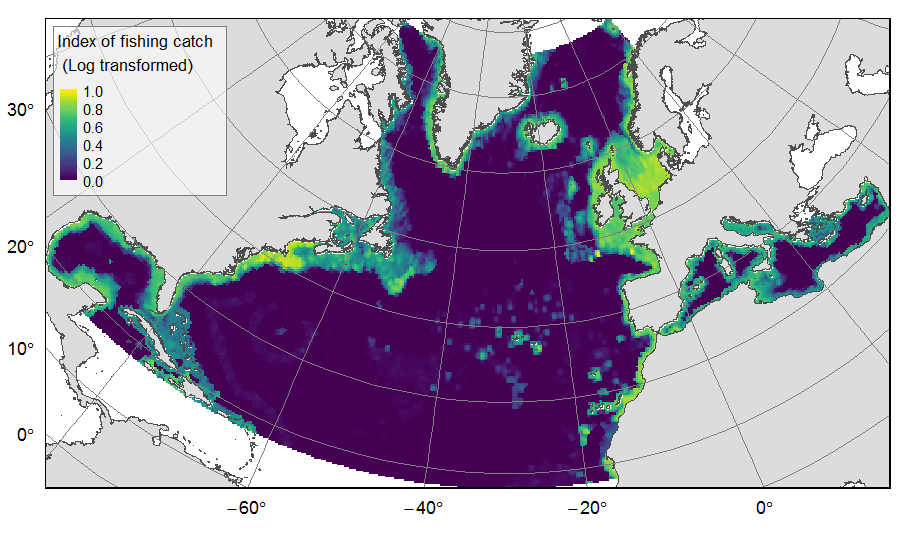
Distribution of catch from deep-sea impacting fishing on the North Atlantic (18°N to 76°N and 36°E to 98°W), for the period 2010-2015. The average of yearly fishing catch for the period 2010-2015 is displayed as an index on the ATLAS grid of 25km * 25km resolution. Source data originated from the Global Fisheries Landings V4.0 database. The dataset was filtered to select only the fishing gears that have an impact on large areas of the seafloor (dredges, bottom trawls, and Danish seines). Within each cell, all remaining catch records were summed to get the total catch rate of the considered year. This dataset was built to feed a basin-wide spatial conservation planning exercise, targeting the deep sea of the North Atlantic. The goal of this approach was to identify conservation priority areas for Vulnerable Marine Ecosystems (VMEs) and deep fish species, based on the distribution of species and habitats, human activities and current spatial management.
-
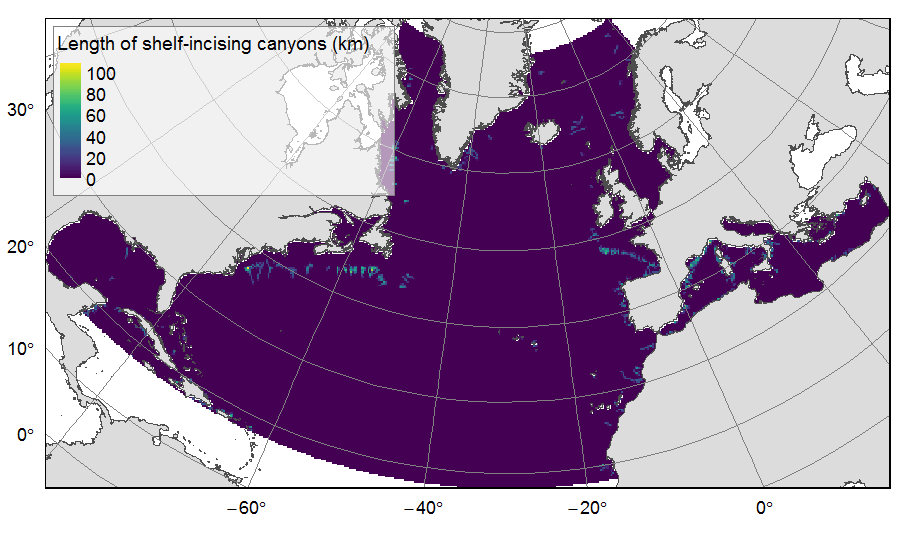
Distribution of three geomorphologic features (fracture zones, canyons, and seamounts) on the North Atlantic (18°N to 76°N and 36°E to 98°W). Source vector data originated from the GEBCO Gazetteer of Undersea Features Names for fractures, Harris & Whiteway (2011) for canyons, and Yesson et al. (2011) for seamounts. The presence (value=1) of fracture zones or seamounts and the total length of canyons (in km, independently for shelf-incising or blind canyons) was extracted in 25km * 25km gridsquares. This dataset was built to feed a basin-wide spatial conservation planning exercise, targeting the deep sea of the North Atlantic. The goal of this approach was to identify conservation priority areas for Vulnerable Marine Ecosystems (VMEs) and deep fish species, based on the distribution of species and habitats, human activities and current spatial management.
-
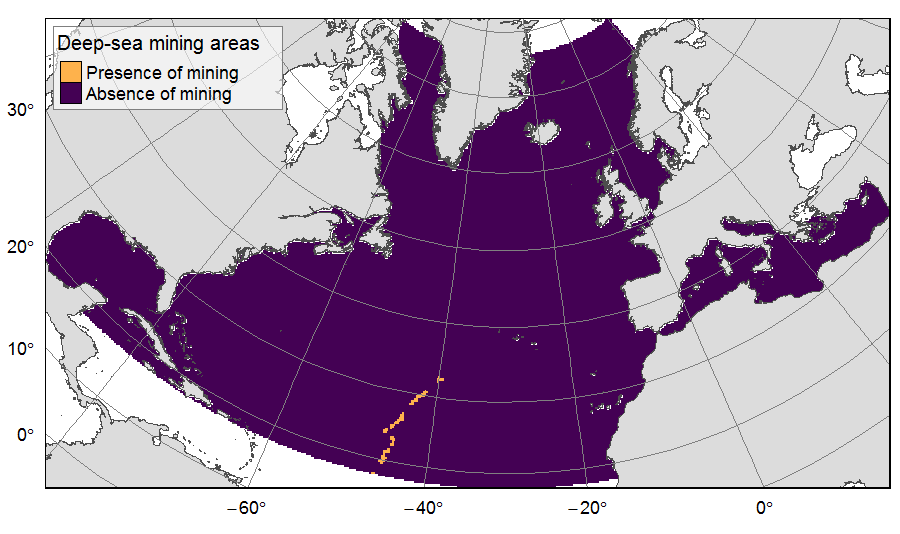
Presence of deep-sea mining exploration zones on the North Atlantic (18°N to 76°N and 36°E to 98°W). These areas correspond to the three polymetallic sulphides exploration contracts on the Mid-Atlantic Ridge, attributed to Poland, France and Russia. Each of the three contract areas is divided into 100 squares of 10km by 10km. Source polygons originated from the International Seabed Authority. The presence (value=1) of deep-sea mining was extracted in 25km * 25km gridsquares. This dataset was built to feed a basin-wide spatial conservation planning exercise, targeting the deep sea of the North Atlantic. The goal of this approach was to identify conservation priority areas for Vulnerable Marine Ecosystems (VMEs) and deep fish species, based on the distribution of species and habitats, human activities and current spatial management.
-
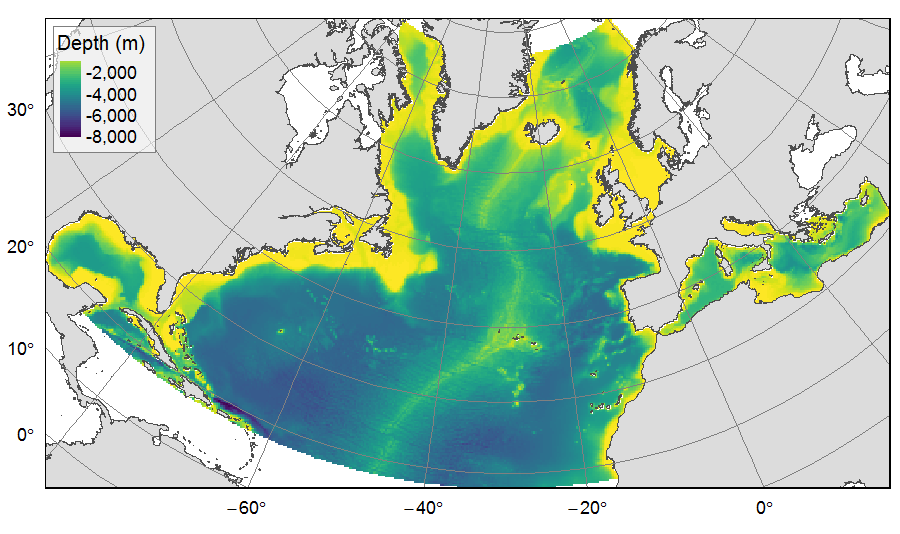
Distribution of three bathymetric terrain variables (depth, slope and Bathymetric Position Index) on the North Atlantic (18°N to 76°N and 36°E to 98°W). This dataset originated from three source layers (3km * 3km resolution) computed within the work package 3 of EU ATLAS project, and based on the EMODnet Digital Bathymetry portal and the General Bathymetric Chart of the Oceans (GEBCO). From these source layers, the mean depth (m), slope (degree) and BPI (no unit) were calculated for each 25km * 25km gridsquare. This dataset was built to feed a basin-wide spatial conservation planning exercise, targeting the deep sea of the North Atlantic. The goal of this approach was to identify conservation priority areas for Vulnerable Marine Ecosystems (VMEs) and deep fish species, based on the distribution of species and habitats, human activities and current spatial management.
-
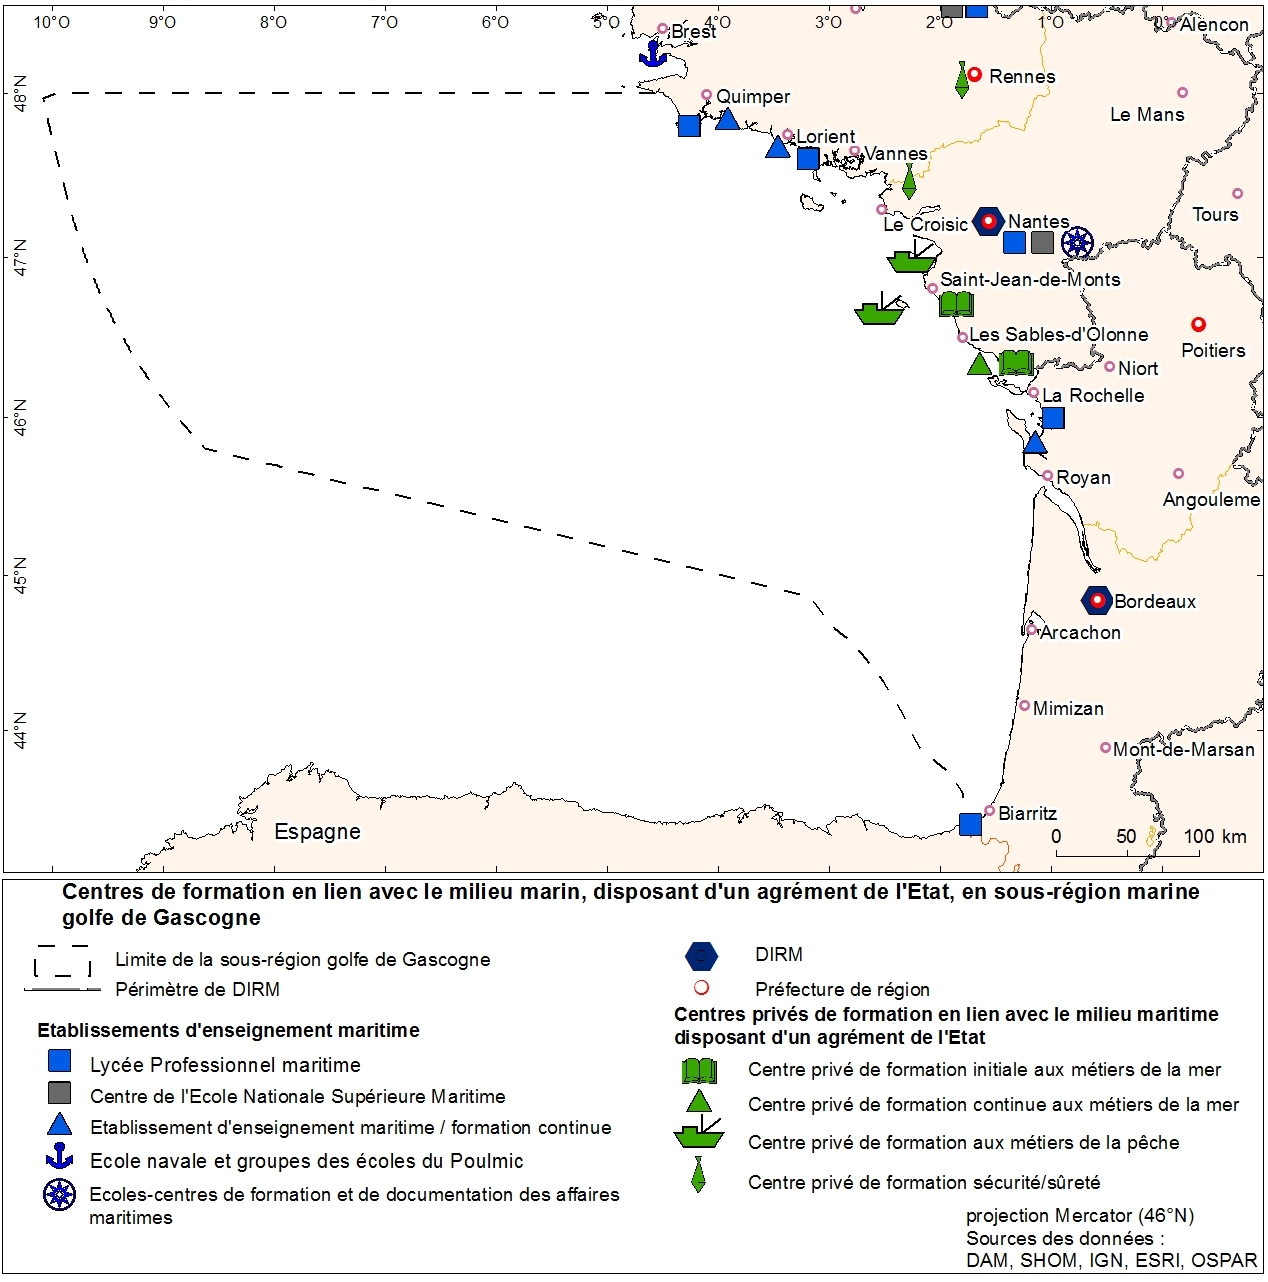
Les organismes de formation aux métiers de la mer géolocalisés à la commune. Cette donnée a été produite dans le cadre de l'évaluation initiale de la DCSMM. Référent expert : Sophie Devergie. AVERTISSEMENT : la structuration spatiale de la donnée doit être améliorée car elle comporte des superpositions de points (plusieurs organismes de formation par commune). Ici l'outil "Representation" d'ArcGis a été mis en œuvre pour faciliter la représentation cartographique de cette donnée qui ne répond pas aux normes de base de la topologie. A terme, la qualité de la donnée pourra être améliorée en affinant la géolocalisation à l'adresse.
-
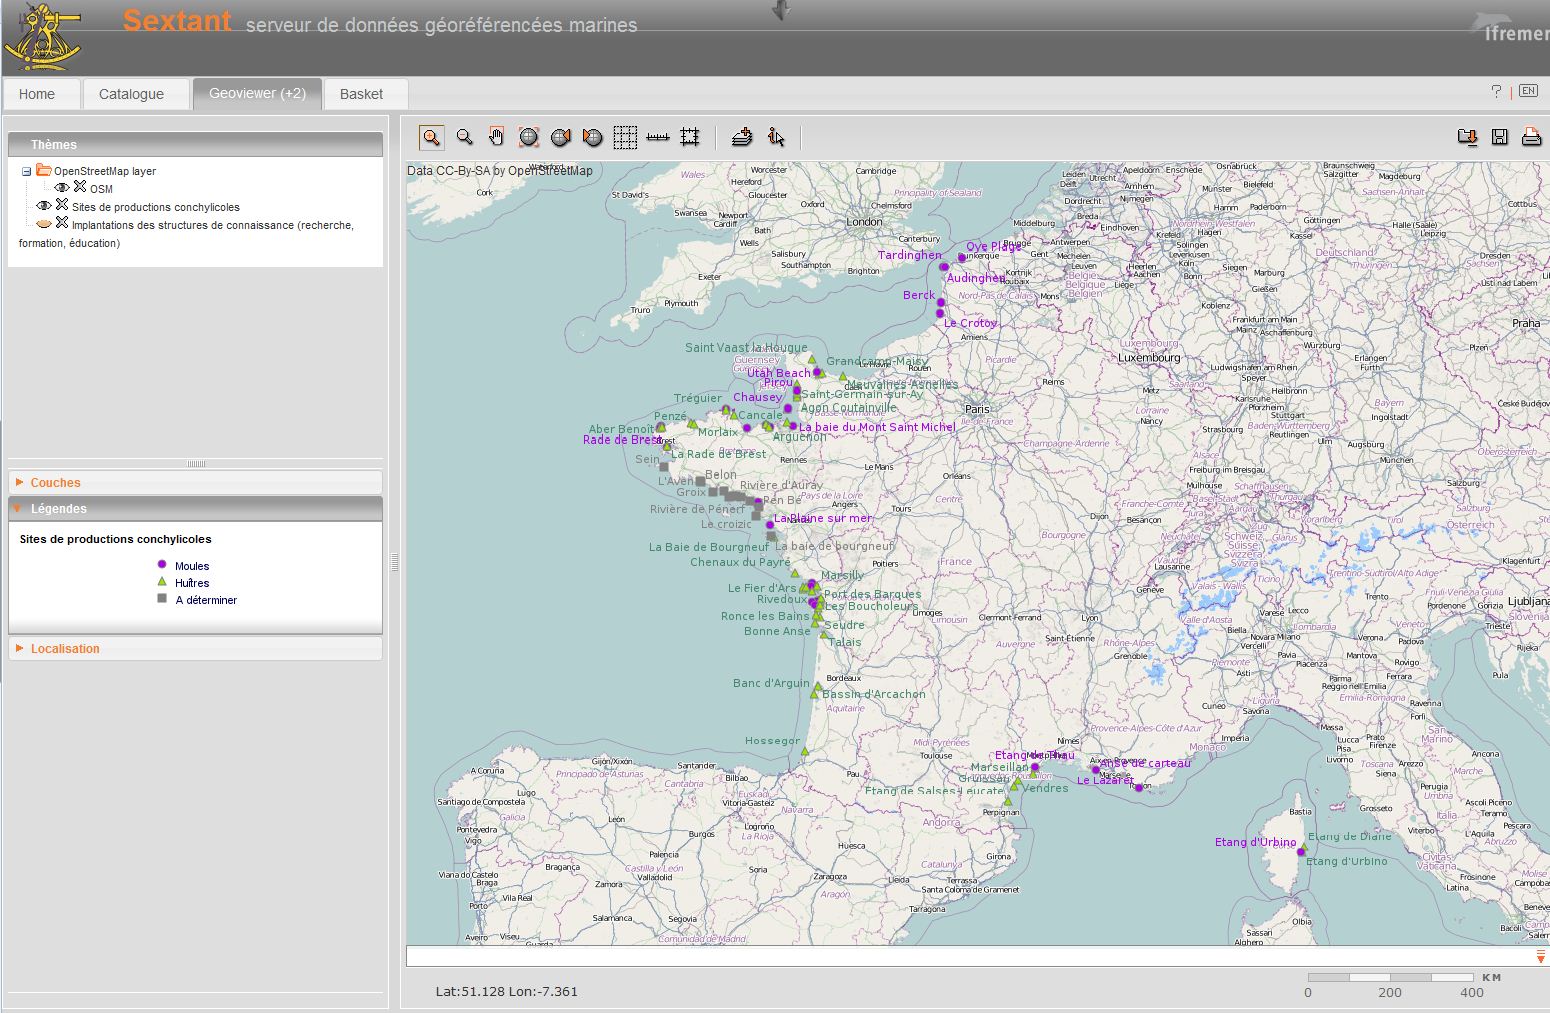
Les sites de production conchylicoles peuvent prendre plusieurs réalités. Parfois, leur identification est réglementaire et sert à la classification sanitaire des zones de productions. Dans le projet Euroshell, le choix a été fait de cartographier les zones de production dont l’identification a du sens à la fois pour les scientifiques et pour les professionnels. Il s’agit alors d’un nombre restreint de zones, souvent correspondant à une réalité hydrographique. En effet, la conchyliculture est majoritairement installée dans des estuaires, embouchures, baies, fjords, rias ou lagunes. Cette carte présente les sites de production conchylicole français, qui regroupent chacun plusieurs zones. Quelques informations sont données concernant les espèces produites, le nombre d'entreprises et/ou concessions et/ou producteurs, la quantité de production approximative.
-
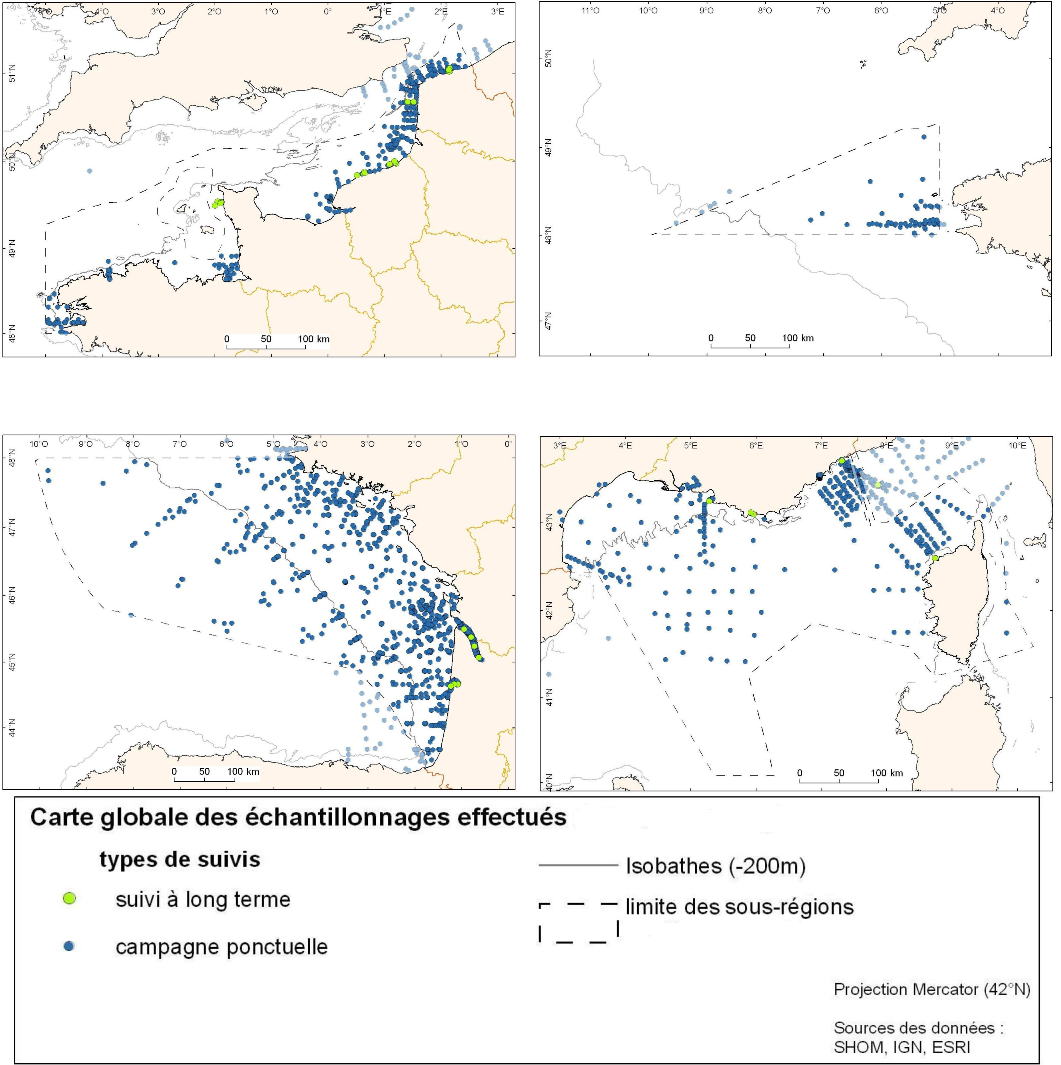
Couche de points représentant l'ensemble des jeux de données liés aux études anciennes et récentes sur les communautés du zooplancton. Les données issues de ce recensement représentent la répartition spatiale des prélèvements effectués depuis 1964 ainsi que les types et engins de prélèvement.
-
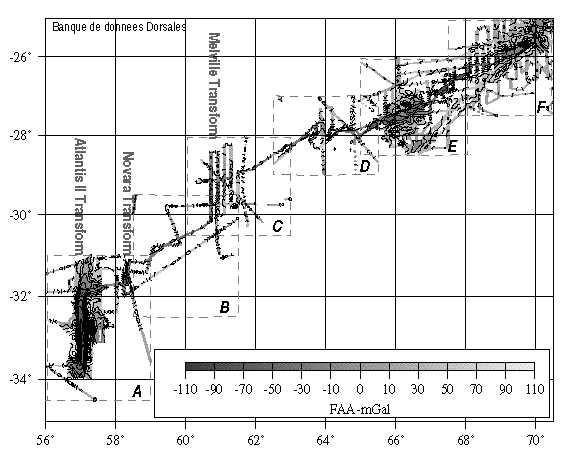
Compilation de données gravimétriques entre 1973 et 1994
-
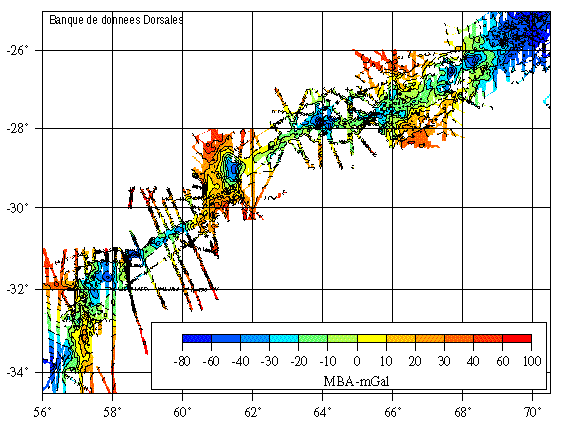
Compilation de données gravimétriques entre 1973 et 1994