 Mon GéoSource
200000
Type of resources
Available actions
Topics
INSPIRE themes
Keywords
Contact for the resource
Provided by
Years
Formats
Representation types
Update frequencies
status
Scale
Resolution
-

Contours du bâti classé en zones primaire, secondaire, tertiaire et quaternaire. Elaborés dans le cadre du SDTAN Languedoc-Roussillon (hors Lozère).
-

Contours des zones de concentration économique élaborés dans le cadre du SDTAN LR (hors Lozère)
-

Données relatives aux chambres, NRA, Zones des NRA, itinéraires de France Télécom dans le cadre du PPP avec CRLR et du décret LME.
-
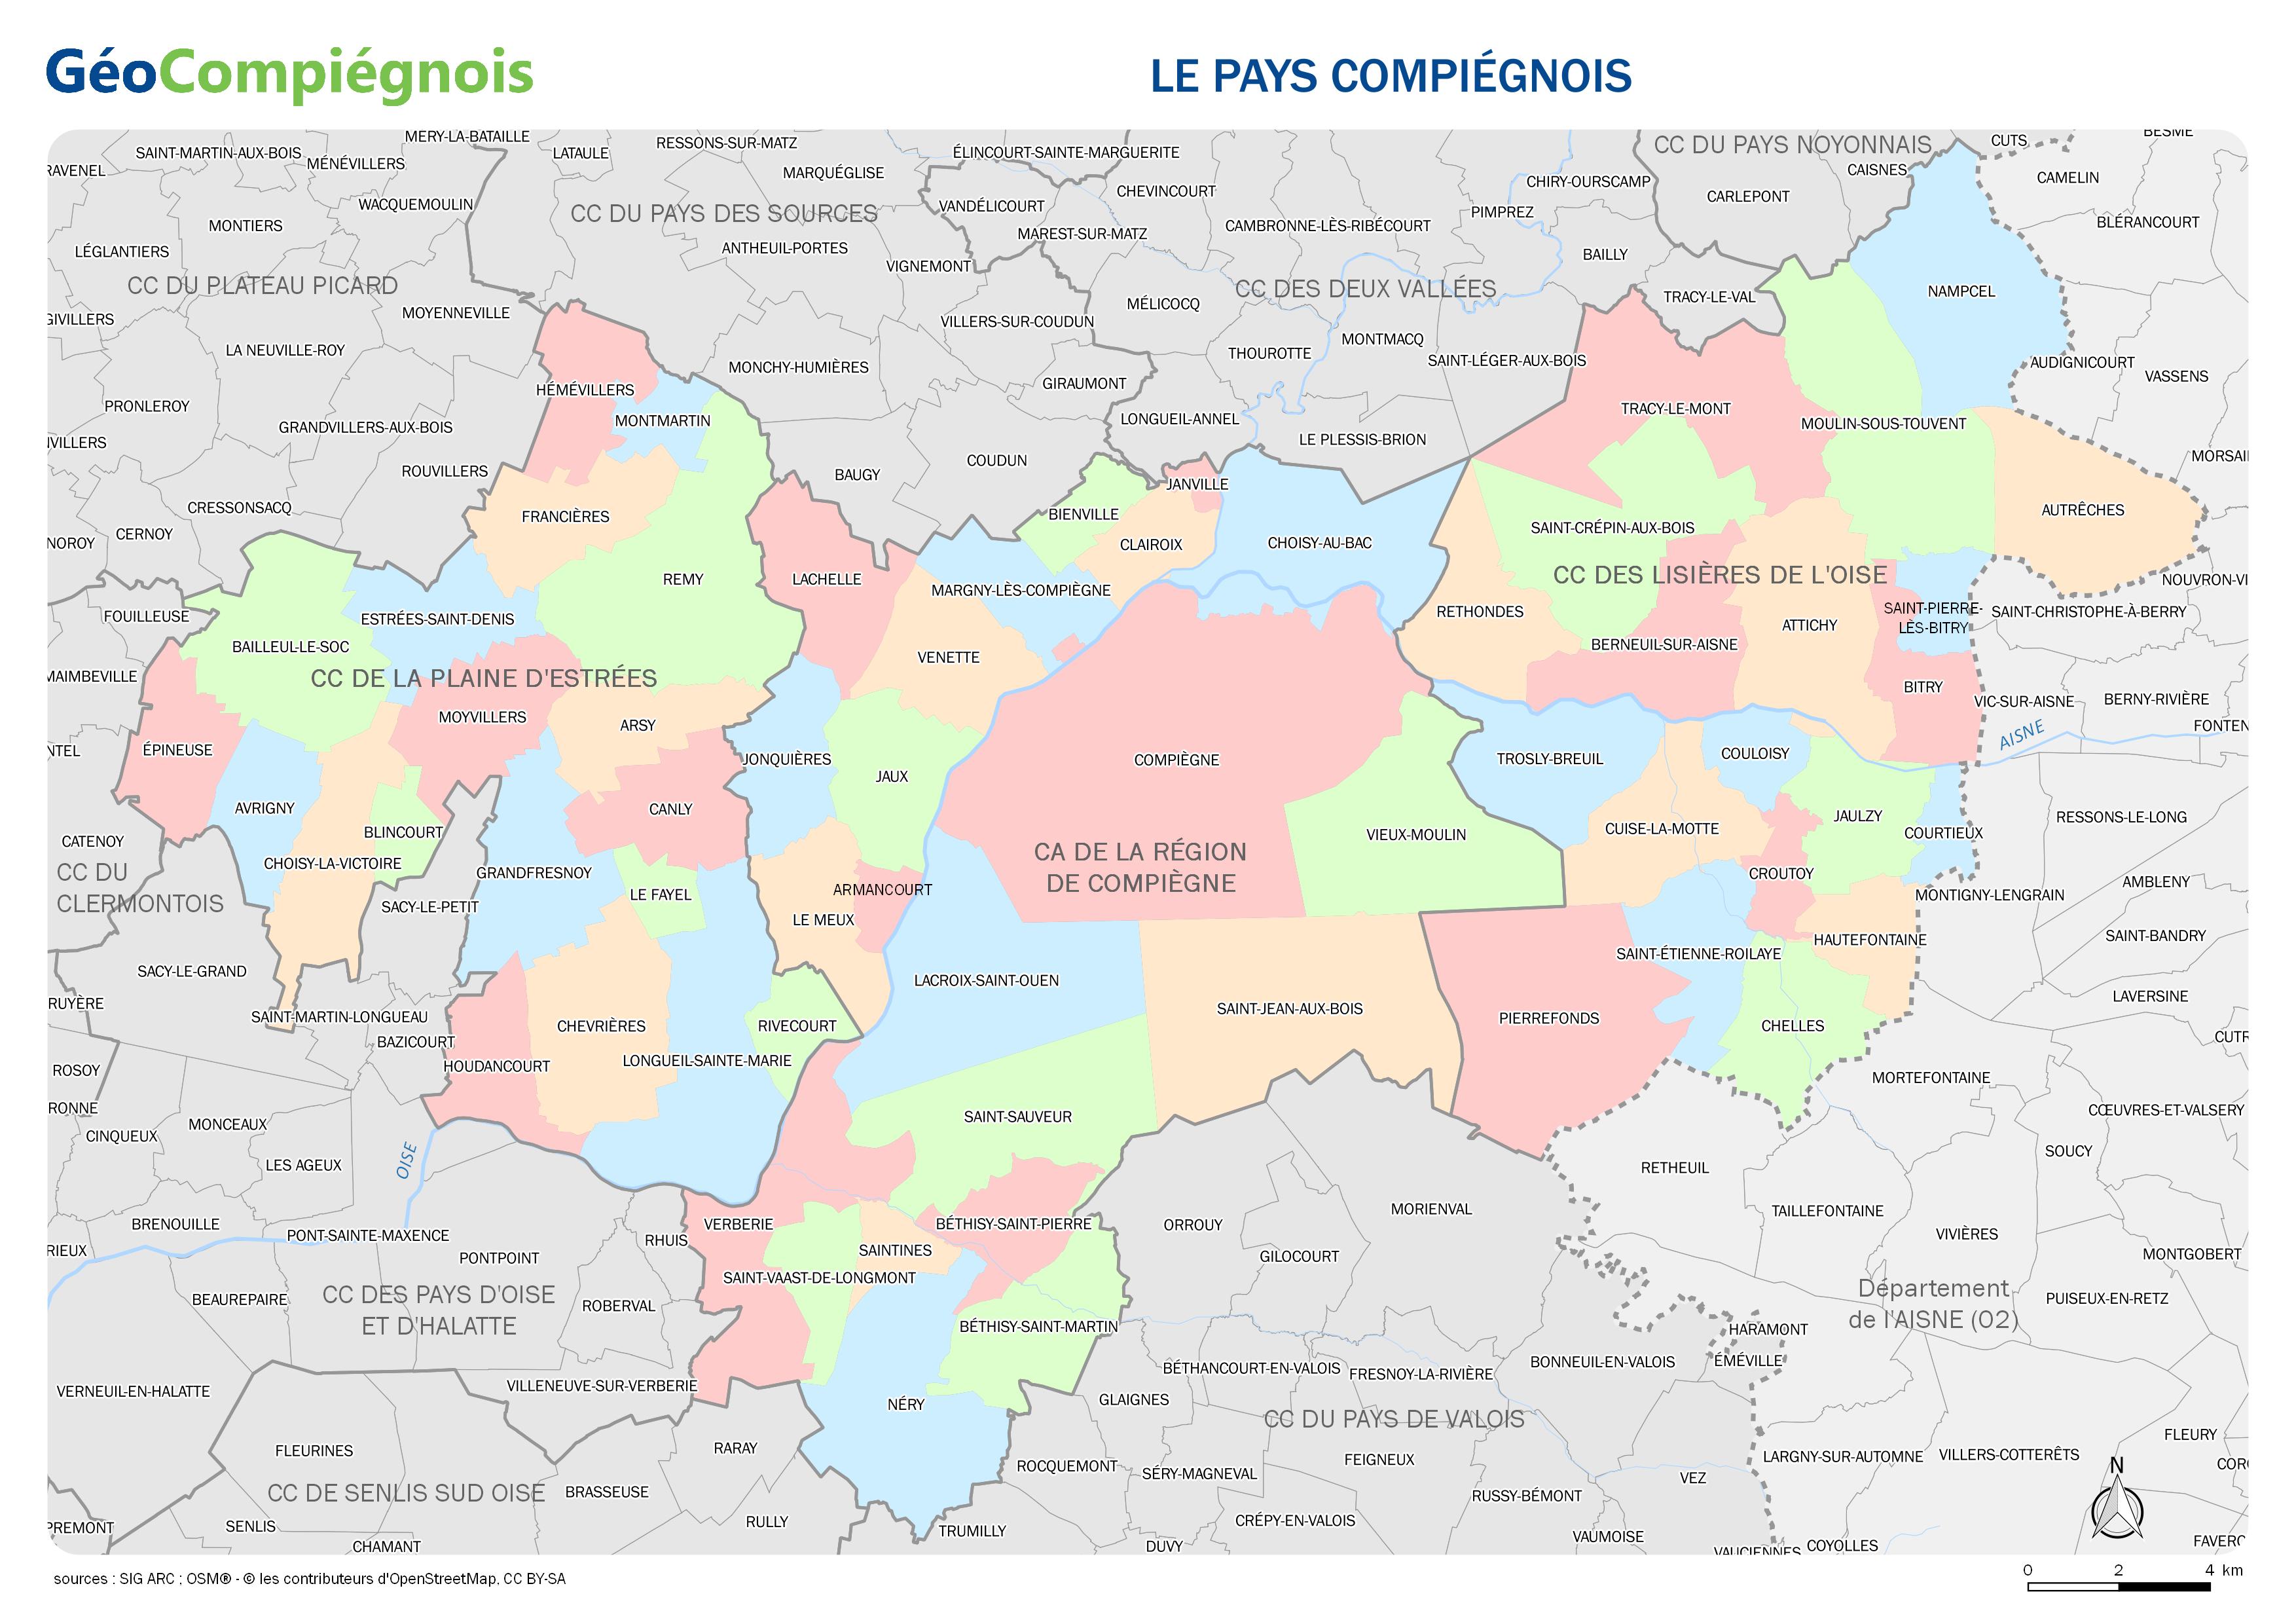
Carte administrative des communes et intercommunalités constituant le Pays Compiégnois.
-
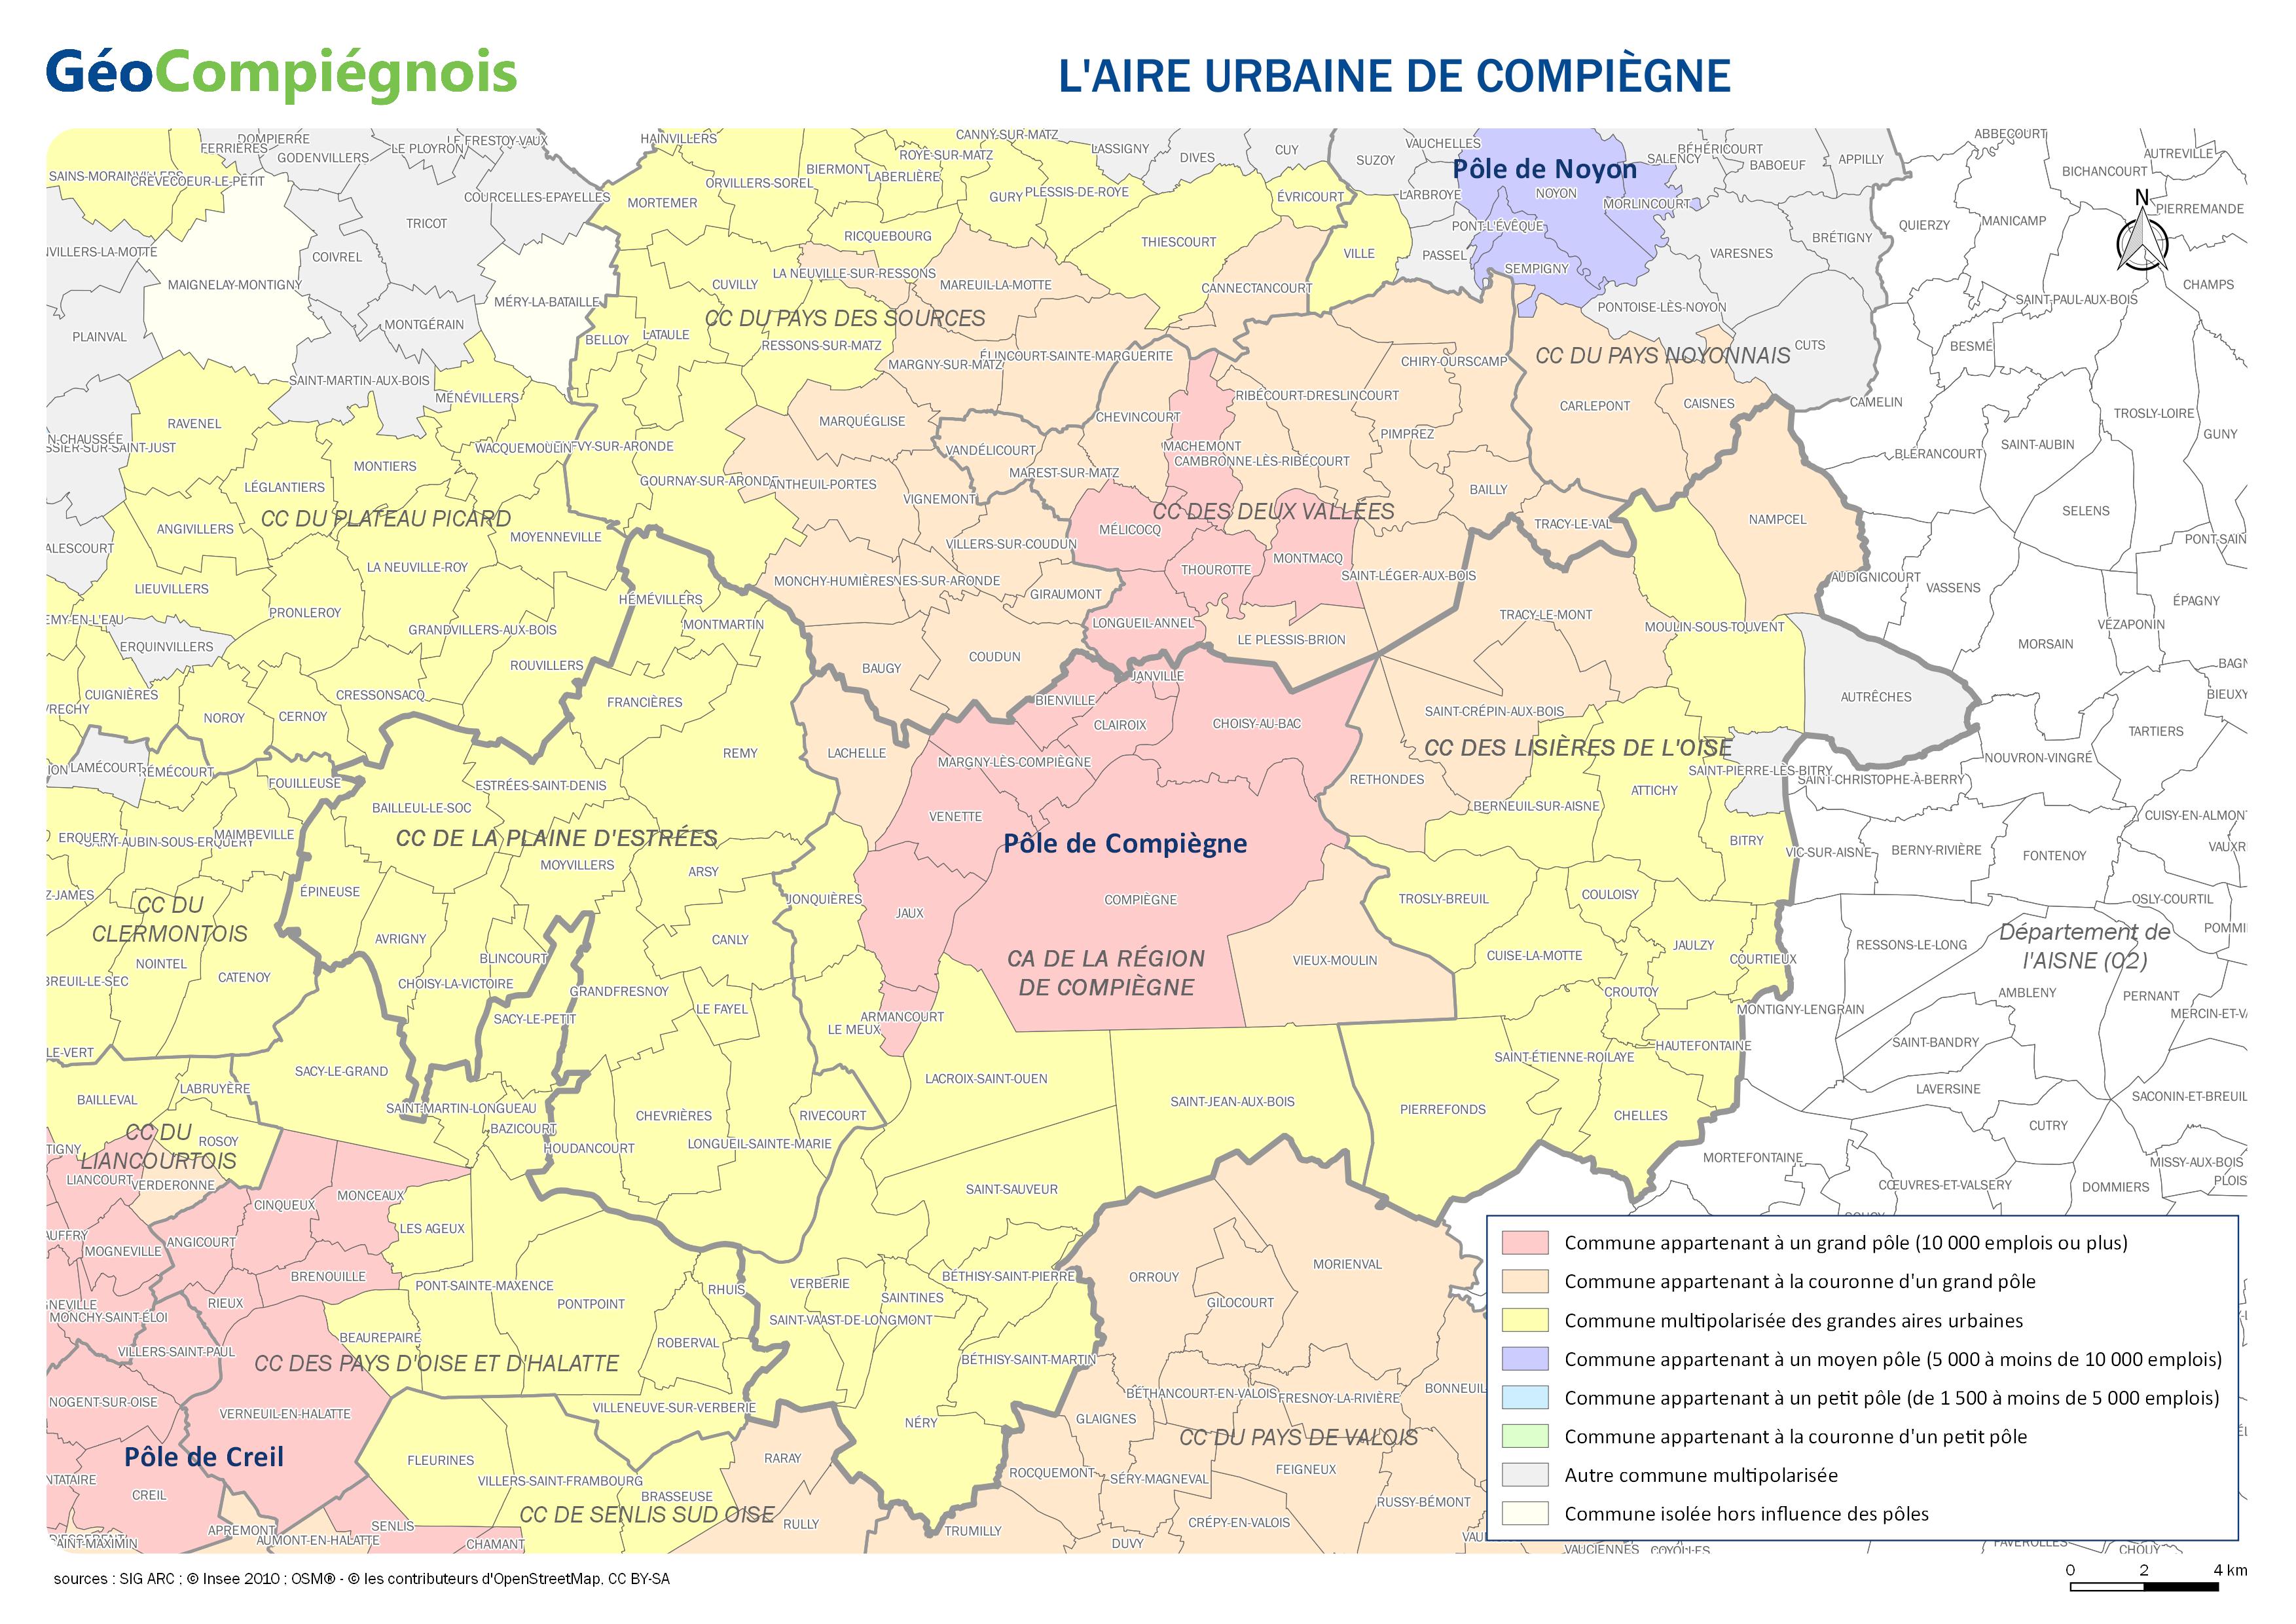
Carte délimitant l'aire urbaine de Compiègne. Donnée issue de l'Insee publiée en 2010.
-
Carte sur les principaux axes routiers de la Communauté d'Agglomération de la Région de Compiègne.
-
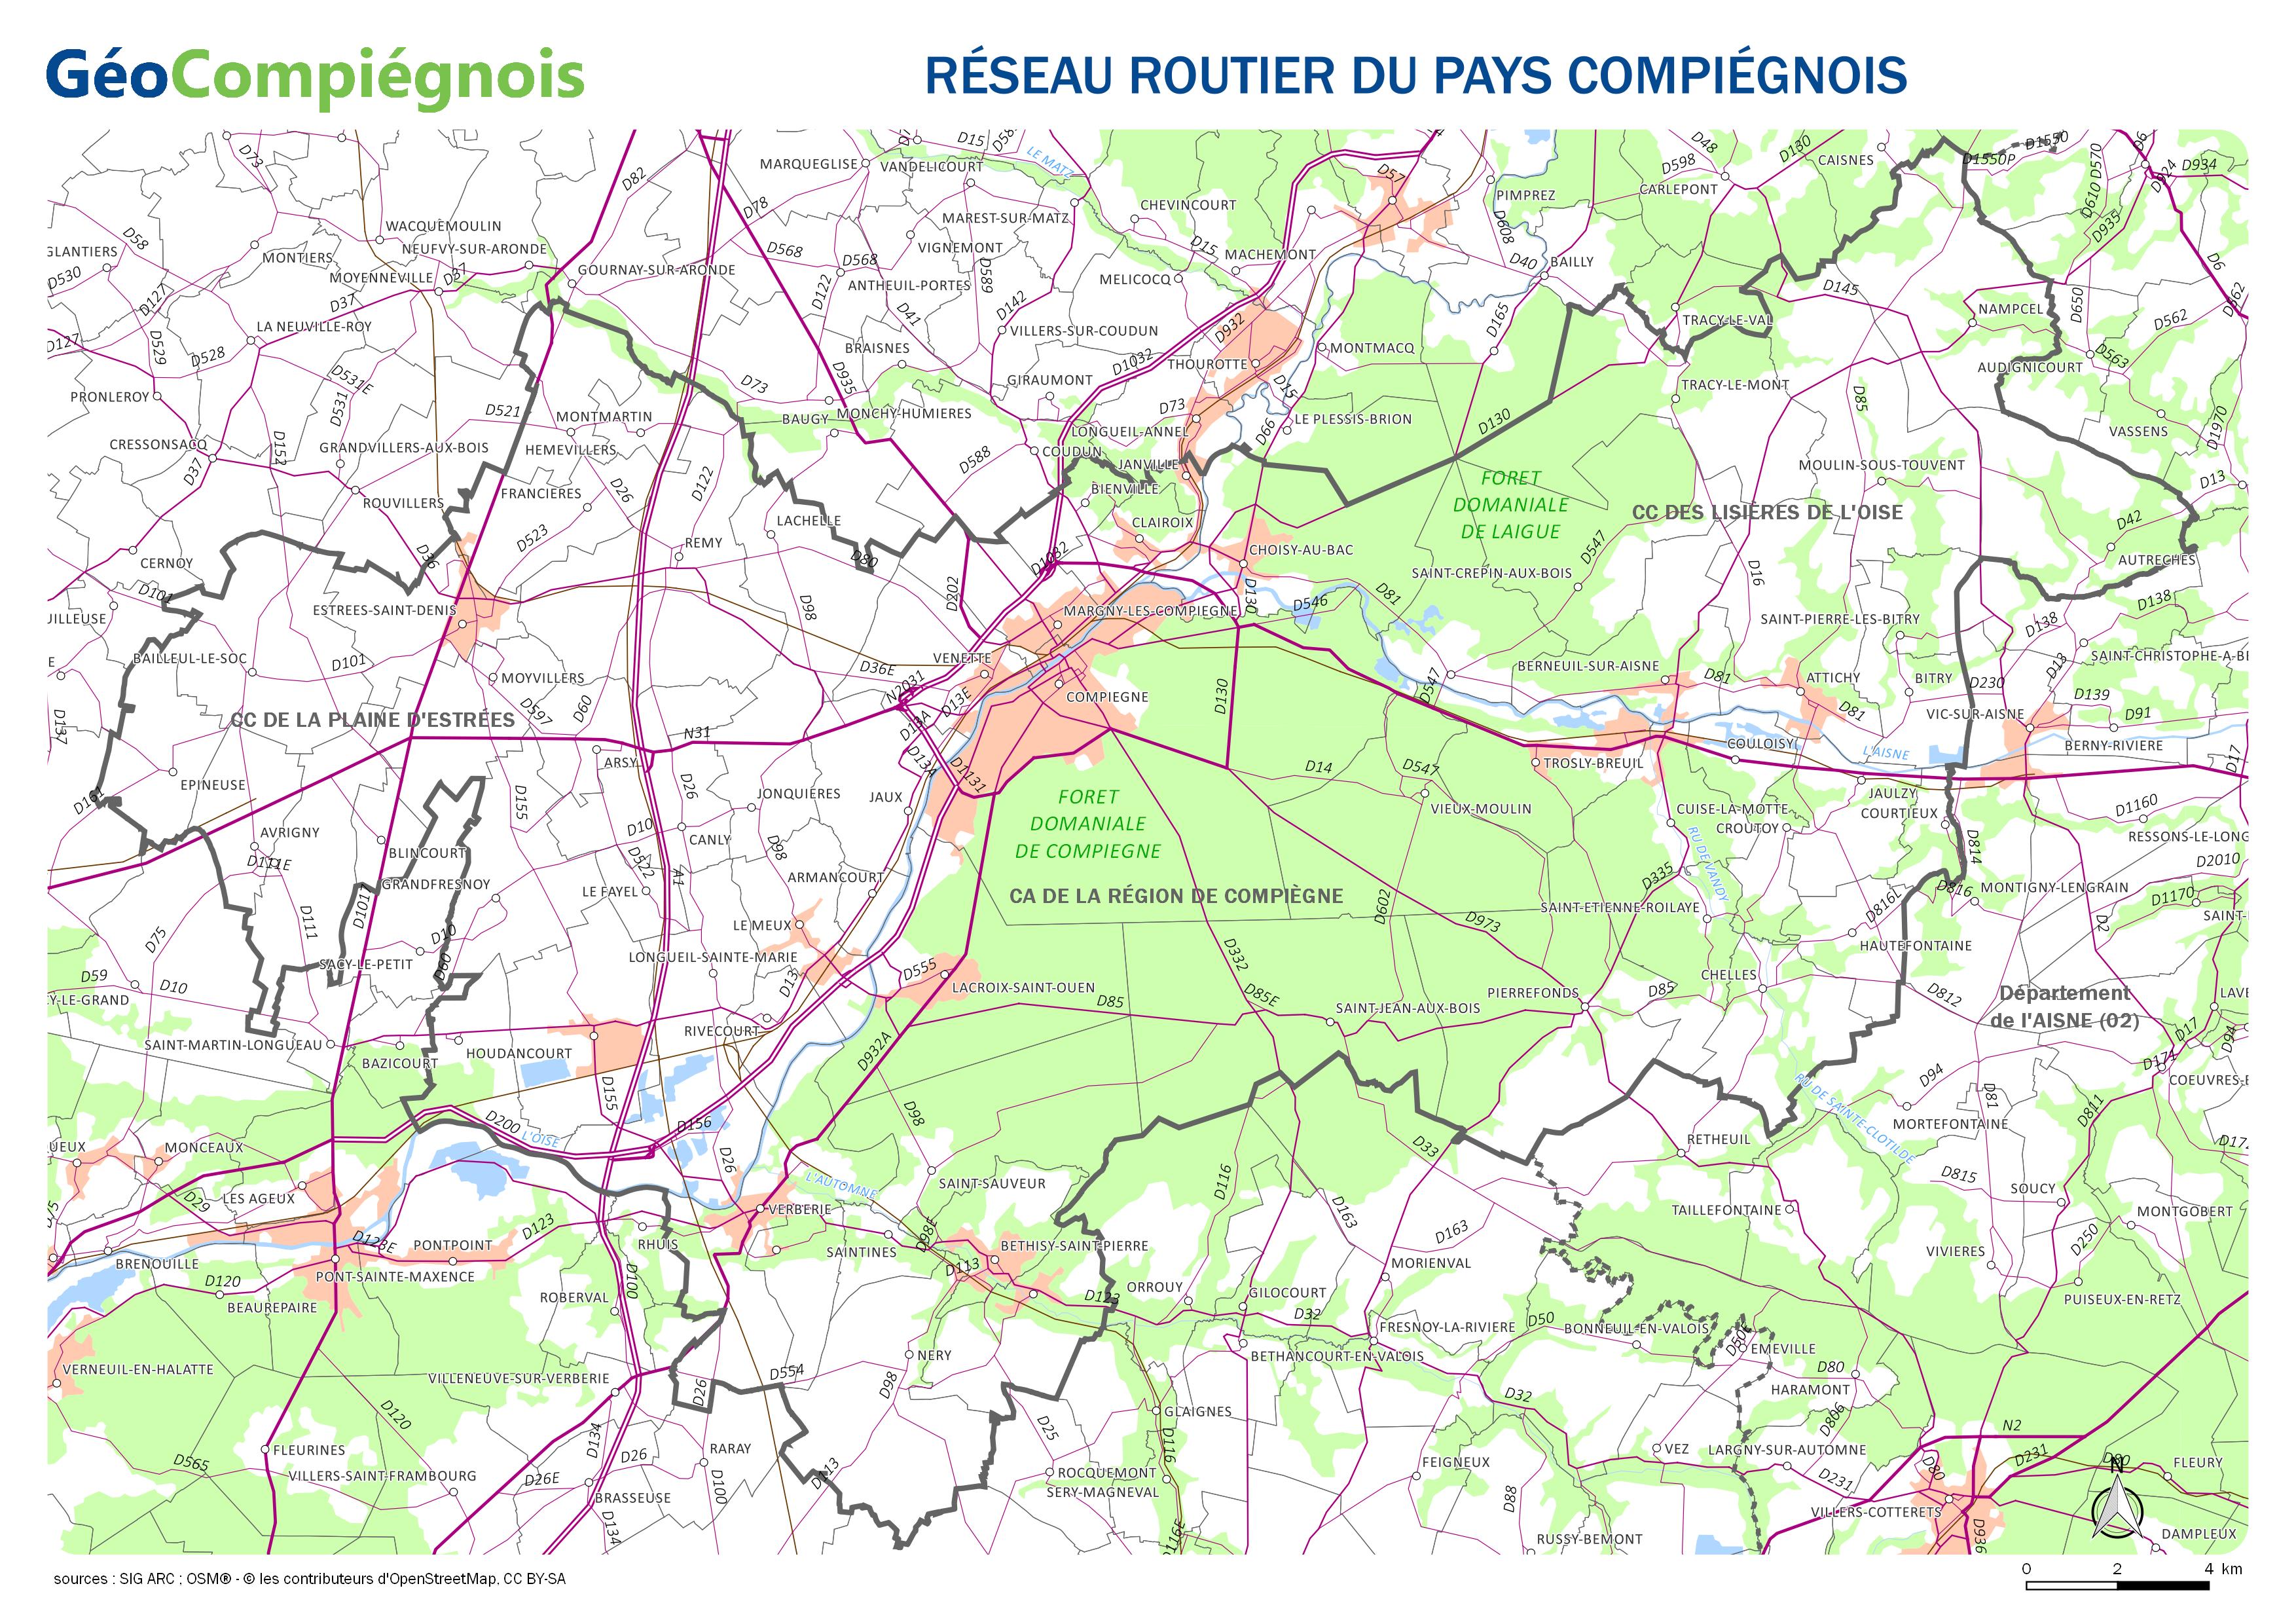
Carte sur les principaux axes routiers du Pays Compiégnois.
-

Cette données représente la dénomination des sols du Languedoc Roussillon. La spatialisation considère les unités cartographiques de la BD-sol (pédopaysages). Le fichier se nomme BdSol_U_Carto.shp Définition des champs : - An_poly : index des polygones - Aire_m2 : aire du polygone en mètre carré - Perim_m2 : périmètre du polygone en mètre carré - No_UC : identifiant du polygone - NOM_UC : Nom de l’Unité Cartographique de Sol.
-

Lot de données concentrant les données relatives aux trames vertes et bleu sur le territoire du Languedoc-Roussillon
-
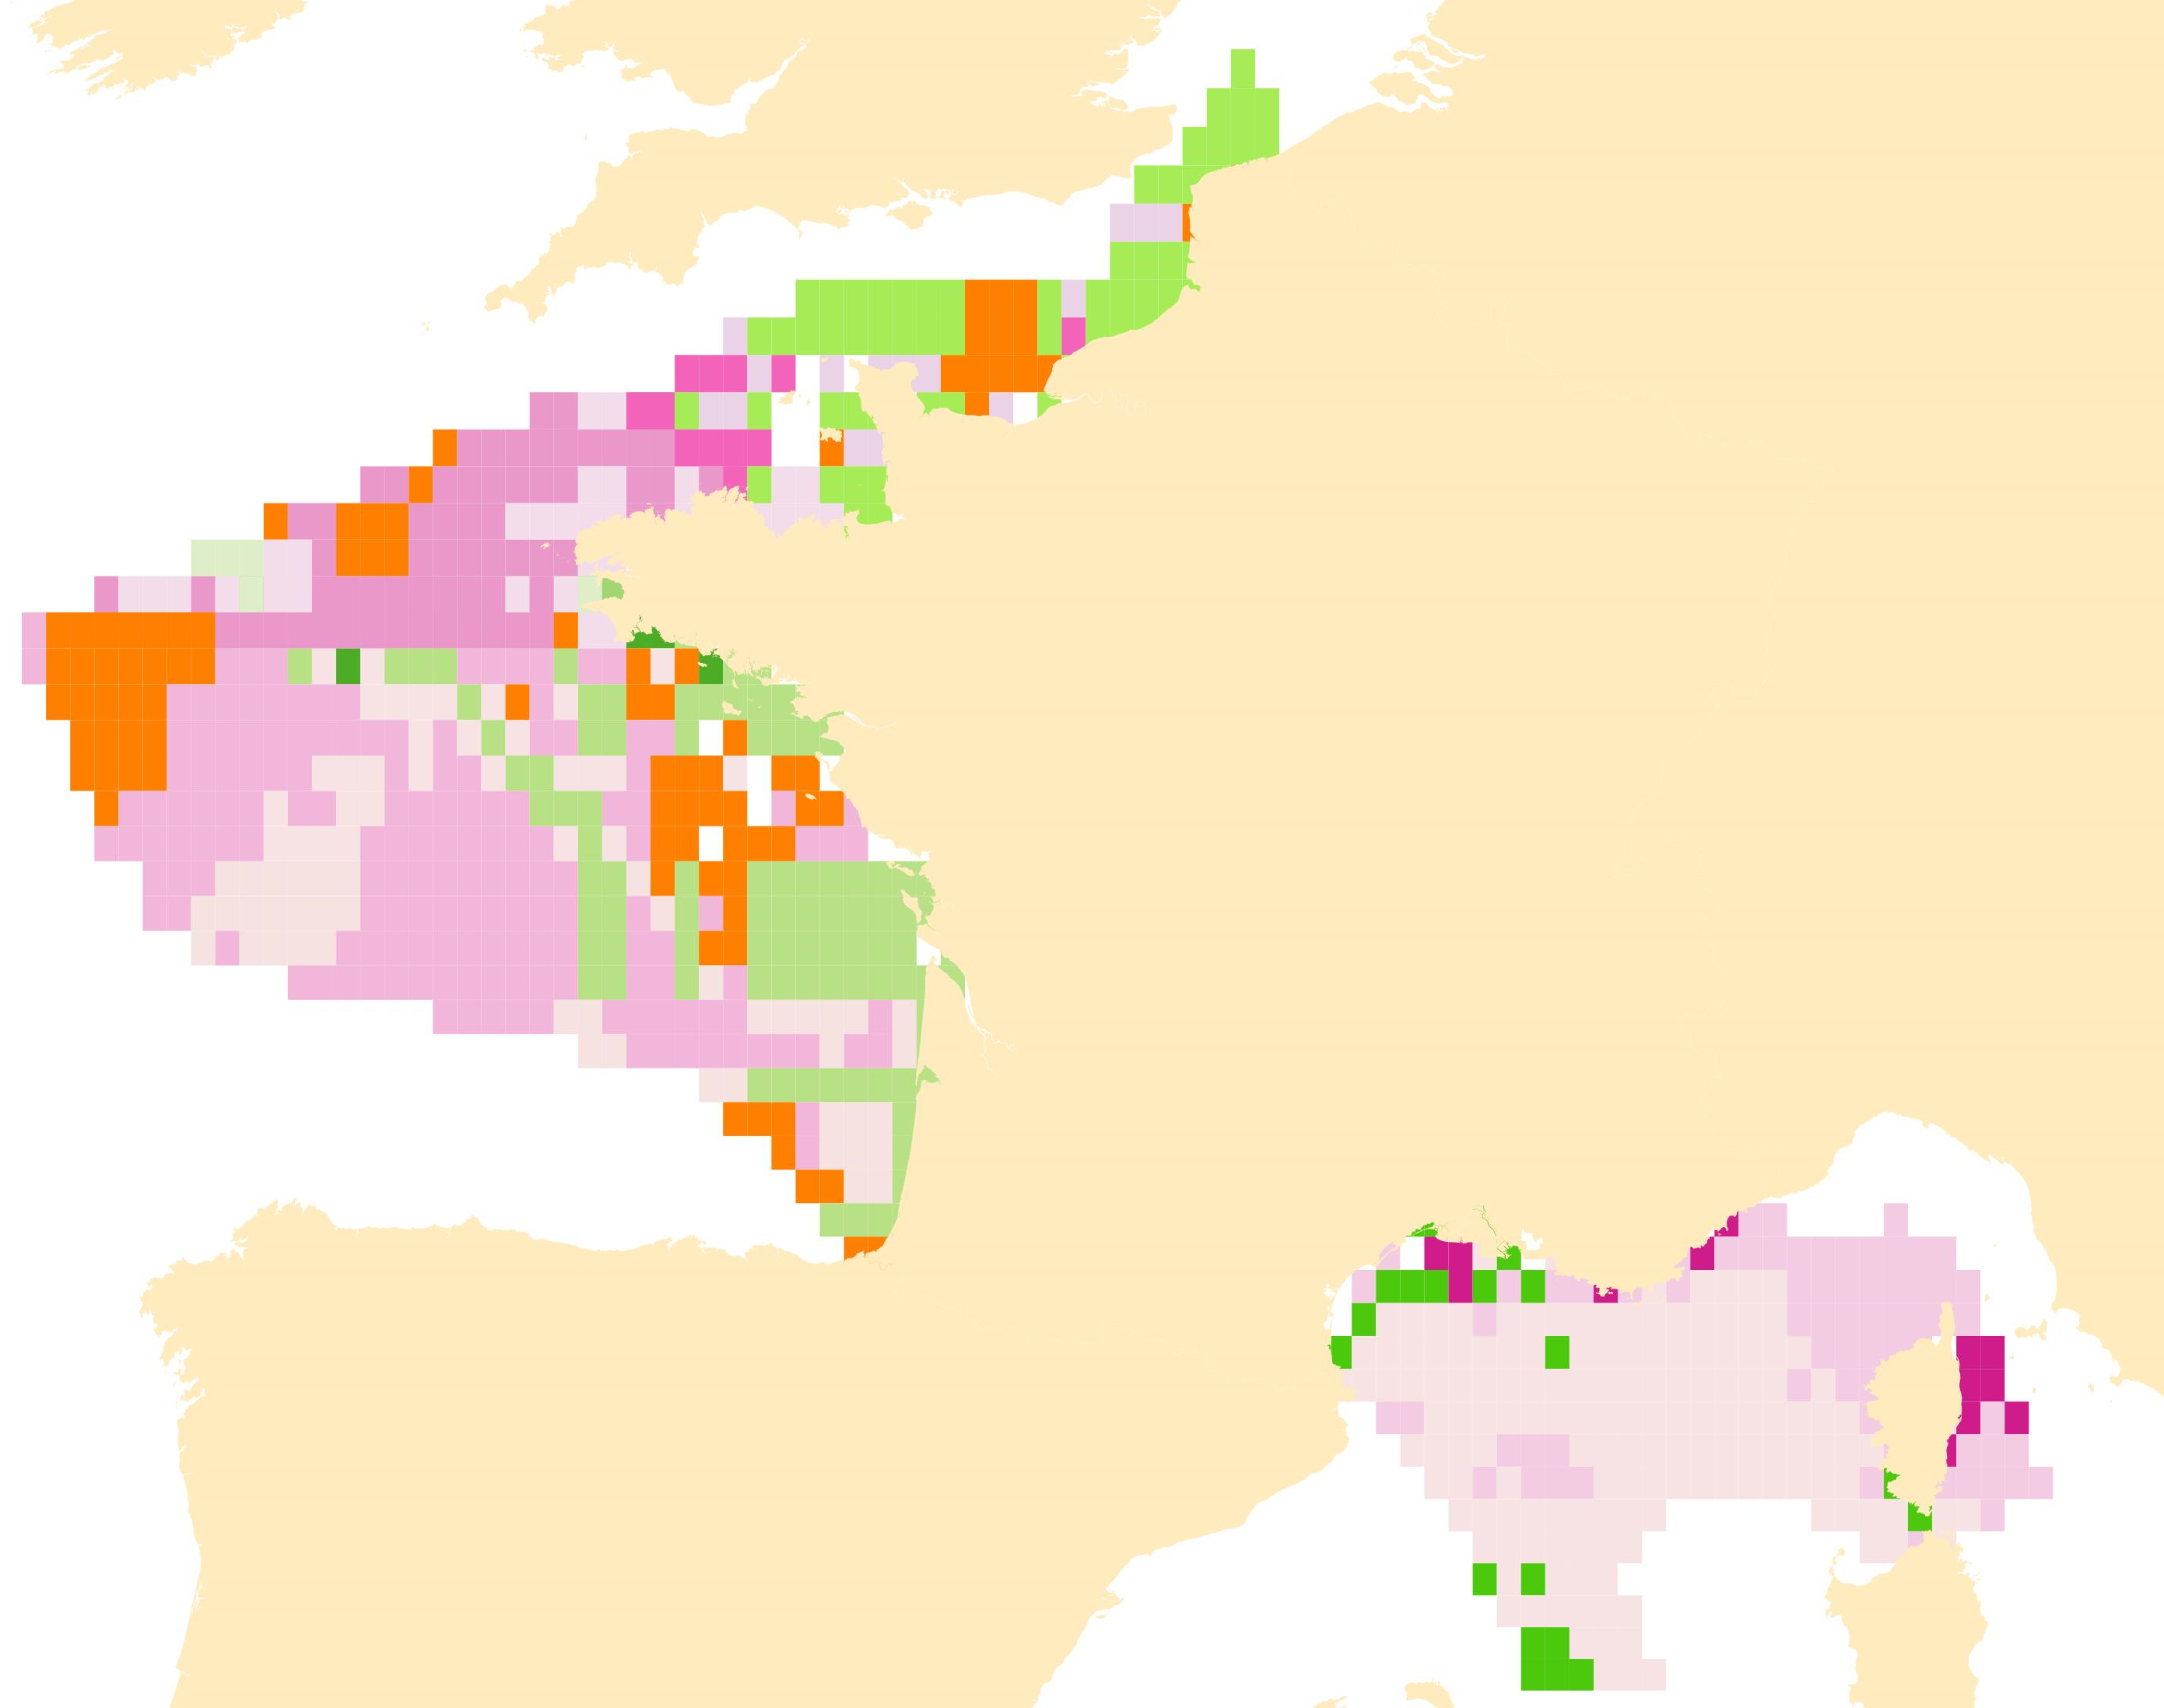
Les sons continus constituent l’un des critères de définition du bon état écologique pour le descripteur 11 relatif à la pression du bruit généré par les activités anthropiques dans le cadre de la DCSMM (D11C2). Le bon état écologique pour l'énergie sonore est atteint lorsque les risques de dérangement acoustique, de surmortalité par exposition sonore et de réduction des distances de communication des mysticètes sont cumulativement faibles ou modérés. Pour cela, la répartition spatiale, l'étendue temporelle et les niveaux acoustiques des sons continus anthropiques ne doivent pas dépasser les niveaux nuisibles aux populations d'animaux marins. Ces critères sont évalués à l’échelle de la sous-région marine pour les régions « Manche et mer du Nord », « Mers celtiques » et « Méditerranée Occidentale »; et à l’échelle des subdivisions « Nord » et « Sud » dans la sous-région «Golfe de Gascogne ». Un des indicateurs retenus pour l'évaluation du critère D11C2 est la distribution spatiale du bruit ambiant annuel à 125 Hz (D11C2.2). La pression considérée pour l'évaluation du critère est le bruit généré par le trafic maritime, principalement dans sa composante commerce et transport qui fait l’objet d’une surveillance réglementaire par système d’identification automatique (AIS). Les données utilisées pour le calcul de cet indicateur sont des données de bruit in situ (dispositif MAMBO) et des données de trafic maritime (Lloyd’s20). Le BEE est atteint pour l’ensemble des sous-régions marines métropolitaines. Les données sont présentées sous forme de fichiers géoréférencés de type shapefile.