 Mon GéoSource
Répartition des espèces
Type of resources
Available actions
Topics
INSPIRE themes
Keywords
Contact for the resource
Provided by
Years
Formats
Representation types
Update frequencies
status
Service types
Scale
Resolution
-

Nombre d'espèces de faune et/ou de flore protégées présentes dans la commune. Résultat pour tous les groupes d'espèces ou pour un groupe d'espèces (flore, insecte, mammifère, oiseau, amphibien, reptile, poisson). Également disponible par maille 5x5 km et par maille 10x10 km. Espèces protégées : espèces bénéficiant d'une protection nationale ou régionale (L. 411-1 et suivants et R. 411-1 et suivants du code de l'environnement). Agrégation des données provenant des bases de données administrées par les animateurs de réseaux de collecte en charge de la validation scientifique des données.
-
Nombre d'espèces de faune et/ou de flore menacées d'extinction présentes dans la commune, selon le statut de liste rouge régional Franche-Comté. Résultat pour tous les groupes d'espèces ou pour un groupe d'espèces (flore, insecte, mammifère, oiseau, amphibien, reptile, poisson). Également disponible par maille 5x5 km et par maille 10x10 km. Espèces menacées : espèce disparue au niveau régional (RE), En danger critique (CR), En danger (EN), Vulnérable (VU), Quasi menacée (NT), Données insuffisantes (DD) Agrégation des données provenant des bases de données administrées par les animateurs de réseaux de collecte en charge de la validation scientifique des données.
-
Ce service permet de consulter les entités géographiques révélant la présence d'enjeux floristiques ou végétation sur le territoire de l'Ile-de-France. Il a vocation à alerter rapidement l'utilisateur sur l'existence de données d'inventaire révélant la présence d'un enjeu flore ou végétation dans un secteur particulier, concerné par un projet d'aménagement, une mesure de conservation ou toute autre opération vis-à-vis de laquelle la question de la présence éventuelle de plantes ou de végétations protégées et/ou menacées est posée. Le cas échéant, le Conservatoire botanique national du Bassin parisien peut être contacté pour avoir des précisions sur la nature exacte des enjeux. ATTENTION, pour des raisons d'interopérabilité avec le Géocatalogue national (notamment pour la visualisation des couches associées au service), il est recommandé de compléter les informations relatives aux opérations du service (voir dans la vue avancée, dans l'onglet Identification).
-
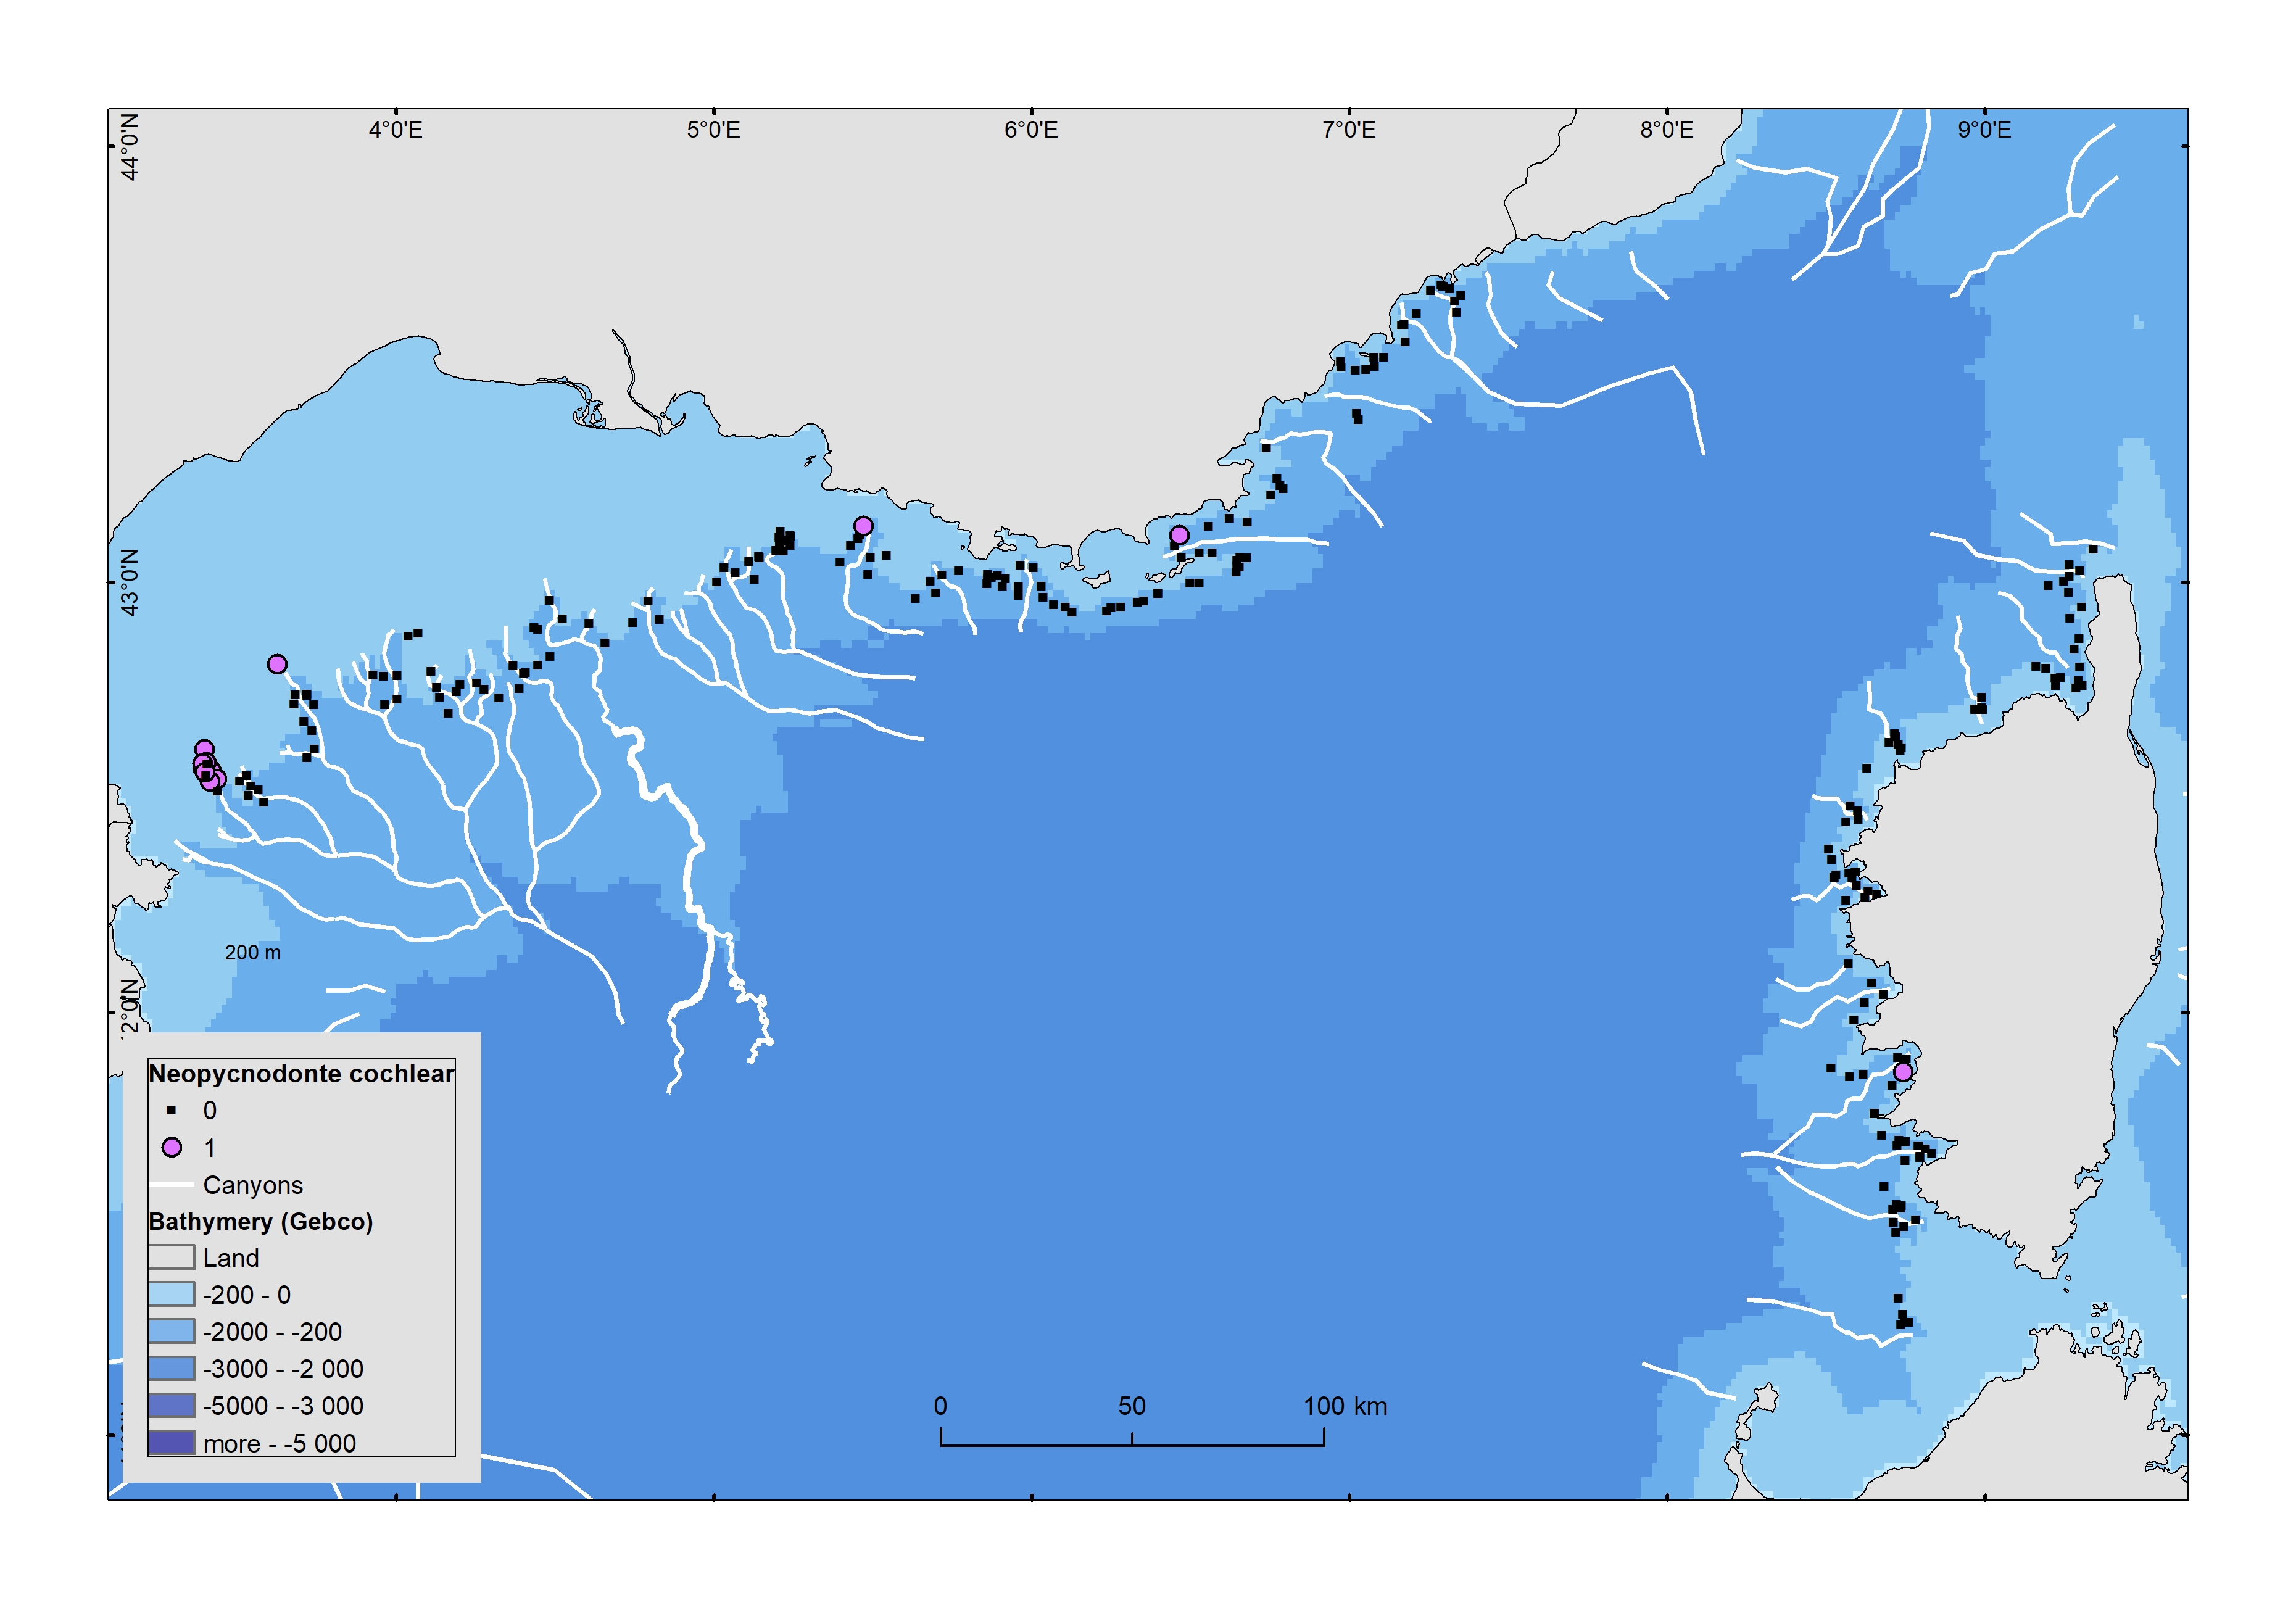
Data were extracted from videos recorded during MEDSEACAN_2009 and CORSEACAN_2010 cruises operated by Comex (Aamp funding). Underwater vehicles were either Achille ROV or Remora submersible. Video analyses were realized by Ifremer and GIS posidonie.
-
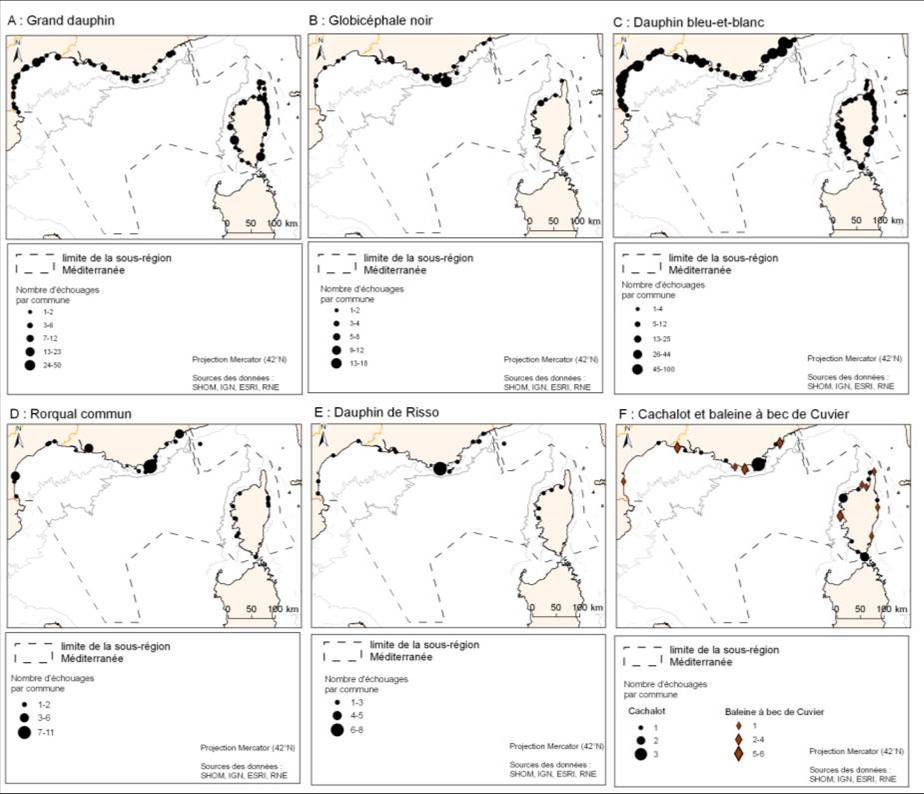
La donnée associée met en évidence les observations d'échouages de mammifères marins réalisées entre 1969 et 2009. Les espèces concernées sont : le grand dauphin, le globicéphale noir, le dauphin bleu-et-blanc, le rorqual commun, le dauphin de Risso, le cachalot et la baleine à bec de Cuvier.
-
Synthèse des connaissances rassemblées par la CPEPESC concernant les chiroptères pour la Franche-Comté de 1992 à 2019.
-
Ensemble des données ornithologiques transmises de la LPO 21-71 et de la LPO 89, transmise par la LPO 21-71, chef de file pour le groupe taxonomique Oiseaux, pour les départements 21,; 58, 71 et 89.
-
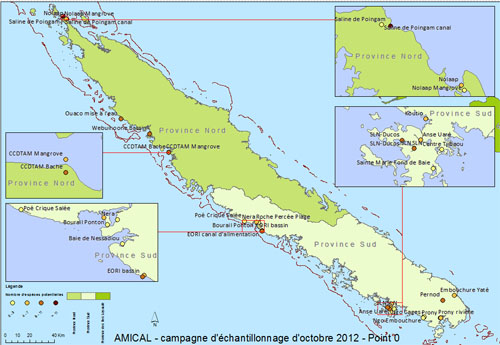
Localisation des sites échantillonnés lors de la première campagne de bioprospection du projet AMICAL (ADECAL/ IFREMER) en octobre 2012. Résultats des comptages de nombre d'espèces potentielles pour la production en photobioréacteur avec une estimation basse, une estimation haute et le potentiel de chaque site.
-
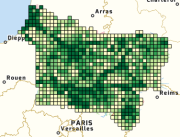
Cette donnée présente un état actualisé des connaissances pour les principaux groupes de faune étudiés, notamment via les réseaux naturalistes picards. Pour chaque maille est indiqué le nombre de taxons trouvés et le nombre d'occurrences de taxons ainsi que l’identifiant de la maille.
-
Métadonnée Conservatoire Botanique National Sud-Atlantique