 Mon GéoSource
dataset
Type of resources
Available actions
Topics
INSPIRE themes
Keywords
Contact for the resource
Provided by
Years
Formats
Representation types
Update frequencies
status
Service types
Scale
Resolution
-
Abstract
-
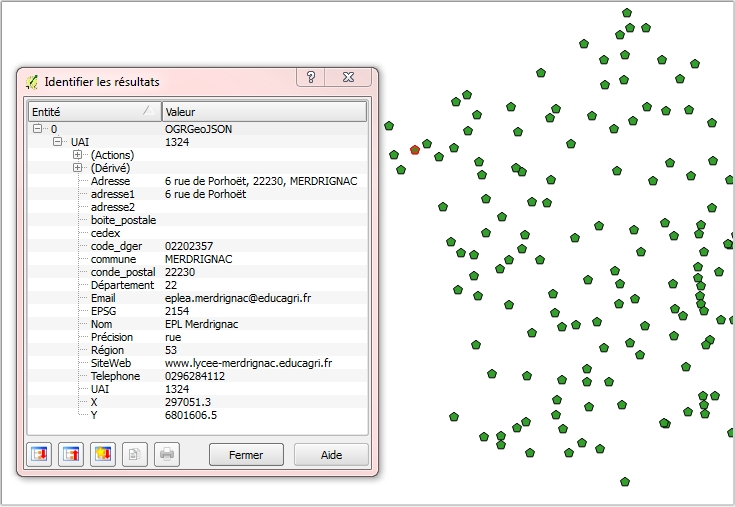
Géolocalisation des établissements publics locaux d’enseignement et de formation professionnelle agricoles : Position géographique des établissements en WGS84 (4326) sur l'ensemble du territoire (France métropolitaine et DOM COM). Attributs : Éléments de contact (nom,adresse, téléphone, mail..) et coordonnées géographiques officielles des établissements concernés. Mise à jour mensuelle. Information de précision des données : Dans la mesure du possible, la donnée est au bâtiment près ou à la rue; il existe cependant des cas où le centre de la commune est le point de référence (cf. champ "Précision").
-
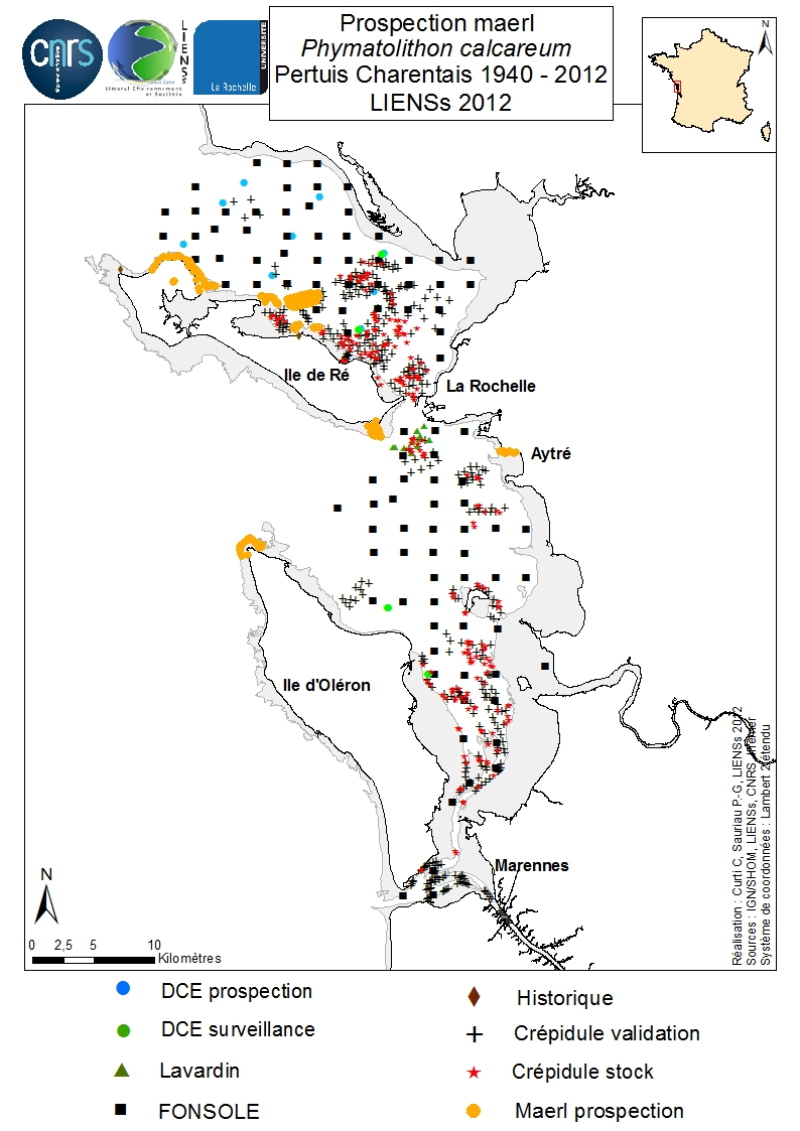
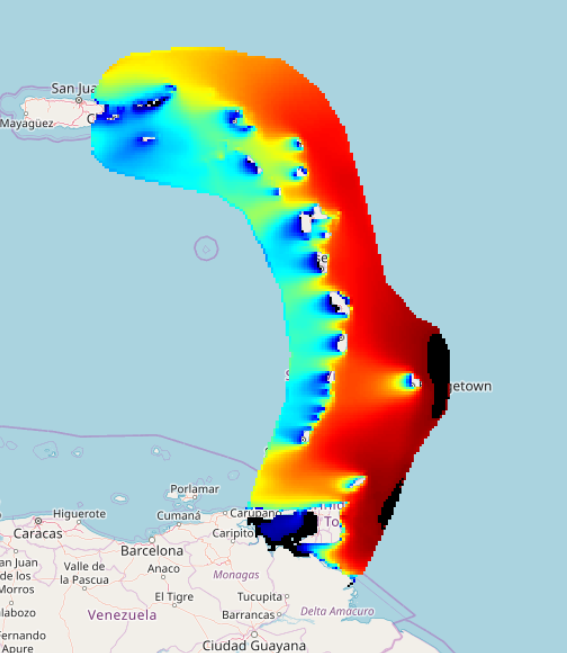
An inventory of mäerl ( unfixed red marine algae Corallinaceae with calcified arbuscular thalli) is taken in the Pertuis Charentais using the compilation of historical data and new observations over the period 2006-2012. The geographic extent of the inventory includes Pertuis Breton, Antioch and Maumusson, extends from the Lay estuary in the north to the Bay of Marennes-Oléron in the south and includes the edges of the islands of Ré, Oléron and Aix. Contributing to this inventory are, surveys DCE 2006 DCE, control monitoring DCE 2007 to 2012 under the aegis of Ifremer and Agences de l’Eau Loire-Bretagne and Adour-Garonne, surveys conducted for the Port Atlantique La Rochelle on the site of dredge spoil deposits in Lavardin from 2007 to 2012, surveys in 2007 FONSOLE by Ifremer and the surveys by Ifremer and laboratory LIENSs to map the crepidula stocks in the Pertuis Charentais Sea. Adding specific surveys conducted in 2011 by the ship Estran by dredge on subtidal bottom sediments of Pertuis Breton and intertidal quadrat in 2012 on the periphery of the islands of Ré, Oléron and along the cliffs of Aytré. The positioning of ground truthing stations were identified by GPS or dGPS. Initially identified by samples of the dredged material in October 2009 during the validation of sonar surveys to individualize stocks of crepidula, a live maerl bed is mapped in July 2011 in the harbor of Saint-Martin in Pertuis Breton. Its area is estimated at more than 2 km². Surveys of pedibus jambi conducted at the point of Grouin and Saint-Martin de Ré has confirmed the presence of live maerl scattered on the lower foreshore. This suggests a scattering of live maerl thalli of several tens of km² around the main bed of Saint-Martin. It is also confirmed by the single algological extraction of Phymatolithon calcareum done at the beginning of the twentieth century in Saint-Martin de Ré by Dollfus, probably already on the lower foreshore as observed in 2012 near the Couronneau beacon. Numerous dead maerl thalli in the procress of diagenesis have also been observed in the East and Southeast of Pertuis Breton and Antioch suggesting passive transport by contributions from live beds farther to the West, including Pertuis in Antioch. The presence of live maerl on the lower foreshore is seen very occasionally in the western islands of Oléron (Pointe Chassiron) and Ré (Phare des Baleines) via recent algologiques and fauna surveys. In biogeographic terms, the maerl bed of Pertuis Breton is the easternmost and southernmost of those known in the Bay of Biscay. The nearest mäerl beds known are respectively located in Noirmoutier (Bourgneuf Bay) and Galicia (Spain). These observations complement the atlas mapping of maerl populations in Europe published under the auspices of the OSPAR Convention. They provide a knowledge base for future conservation actions defined locally in the context of Natura 2000 Sea Marine Natural Park of the Gironde estuary and the Pertuis Charentais.
-
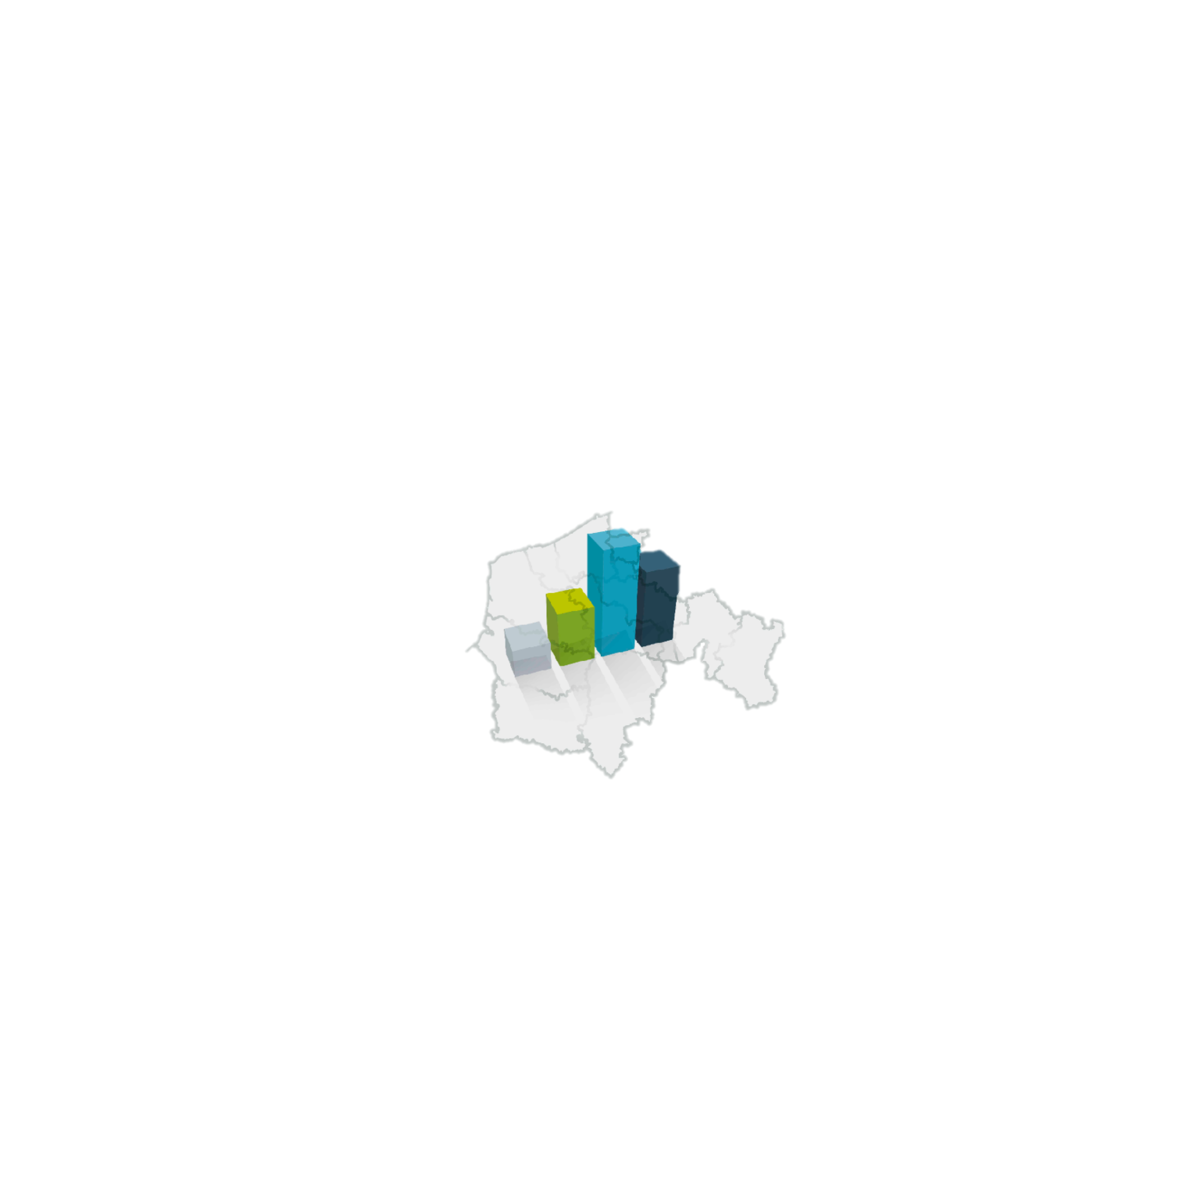
The average household size of private households by administrative unit (region, province, district and municipality) for Wallonia
-
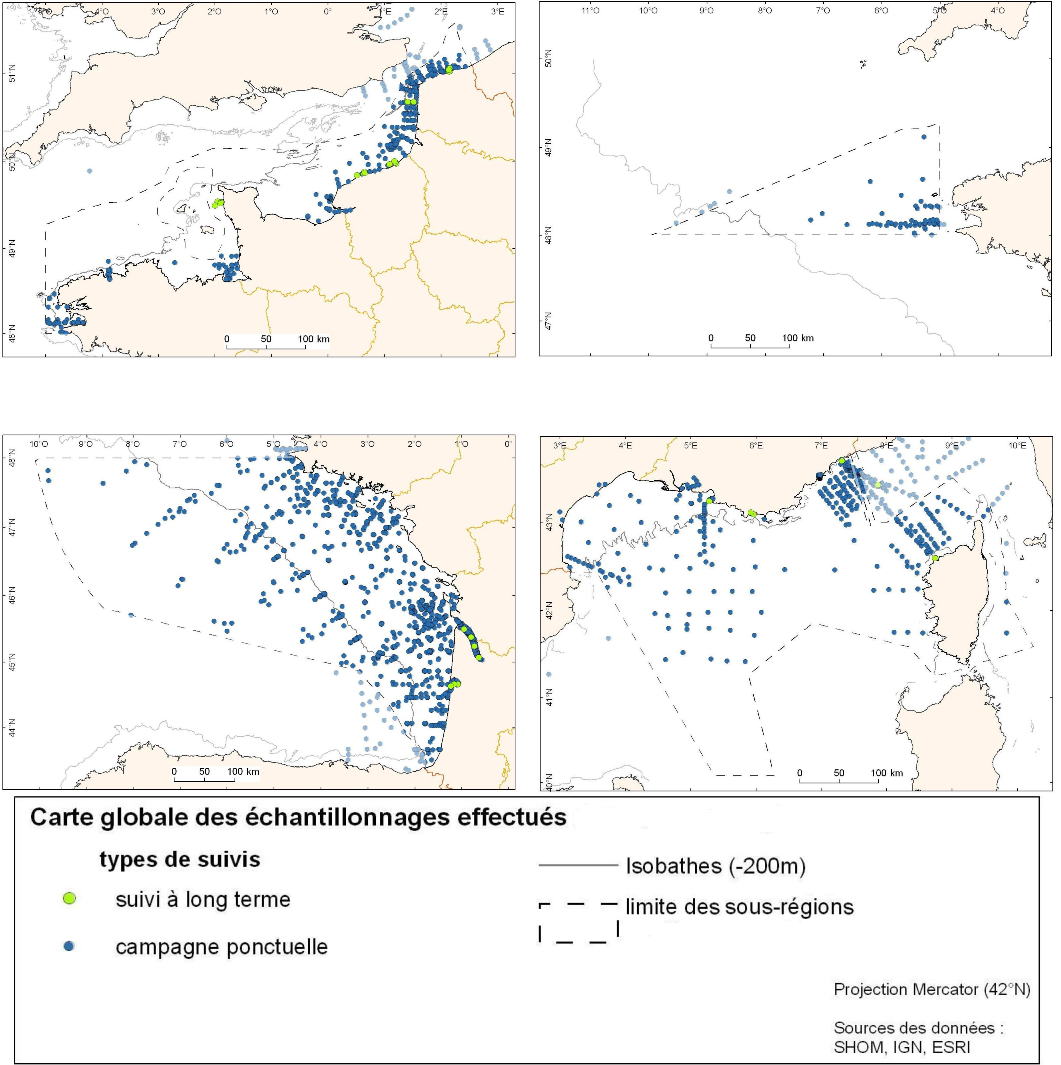
Cold-water coral habitat mapping in submarine canyons of the bay of Biscay was realized by the deep sea laboratory of Ifremer. Data came from the EVHOE 2012 cruise in the framework of the CoralFish project and as part of an agreement between Ifremer and the Agence des Aires Marines Protégées. The method was based on image analyses. Images were acquired using the towed camera « SCAMPI » during the EVHOE 2012 cruise (from 18/10/2012 to 02/12/2012, chief scientists: Jean-Pierre LEAUTE and Michèle SALAUN). Observed habitats were defined according to the CoralFish typology (J.S. Davies, B. Guillaumont, F. Tempera, A. Vertino, L. Beuck, S.H. Ólafsdóttir, C.J. Smith, J.H. Fosså, I.M.J. van den Beld, A. Savini, A. Rengstorf, C. Bayle, J.-F. Bourillet, S. Arnaud-Haond, A. Grehan, 2017. A new classification scheme of European cold-water coral habitats: Implications for ecosystem-based management of the deep sea, In Deep Sea Research Part II: Topical Studies in Oceanography, Volume 145, 2017, Pages 102-109, ISSN 0967-0645, https://doi.org/10.1016/j.dsr2.2017.04.014).
-
IOWAGA sea-states hindcast database generated by the wave model WAVEWATCH-III and forced by ECMWF winds on the North East Atlantic grid over 1990-2012 period.
-
-
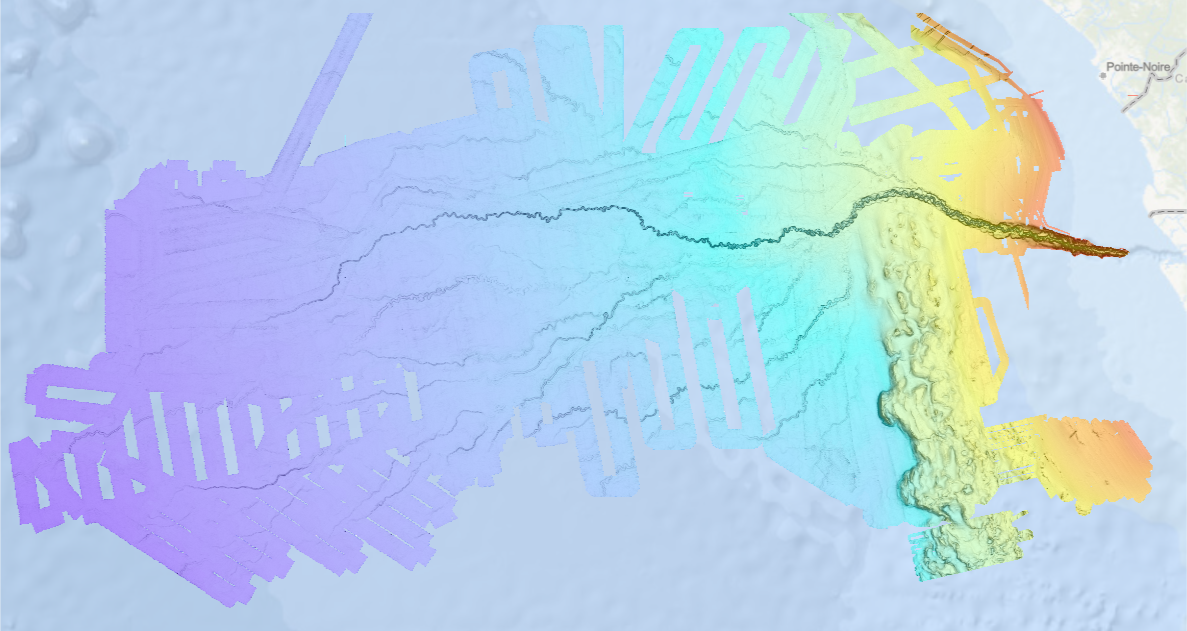
Bathymetry of the Congo fan (synthesis, 2013), with a spatial resolution of 100 meters (WGS84 / Mercator 5°30'S). This dataset is a compilation of bathymetric data from several cruises. Cruise descriptions : - VANGRIESHEIM Annick (2005) BIOZRECUP2 cruise, RV Beautemps-Beaupré, https://doi.org/10.17600/5090030 - COCHONAT Pierre, ROBIN Agnès (1992) GUINESS I cruise, RV L'Atalante, https://doi.org/10.17600/92004211 - OPTIC CONGO 2 - MARSSET Tania, DROZ Laurence (2010) REPREZAI_LEG1 cruise, RV Pourquoi pas ?, https://doi.org/10.17600/10030170 - OLU Karine (2011) WACS cruise, RV Pourquoi pas ?, https://doi.org/10.17600/11030010 - SAVOYE Bruno (1998) ZAIANGO1 cruise, RV L'Atalante, https://doi.org/10.17600/98010100 - COCHONAT Pierre (1998) ZAIANGO2 cruise, RV L'Atalante, https://doi.org/10.17600/98010110 - BOURILLET Jean-François (2000) ZAIANGOCAR cruise, RV Le Suroît, https://doi.org/10.17600/20050 - GELI Louis (2000) ZAIANGO-OBS-BIOL cruise, RV Le Suroît, https://doi.org/10.17600/20040
-
Average maps were computed based on the interpolated maps of the two periods only. Biologic data have been expressed in abundance (numbers or density values (nbr/km²)) and always required to be log-transformed using a log10(x+1) transformation.
-

Size-weight relationships are specific to each scientific species and its environment. They allow the size of an individual to be determined from its weight or vice versa. These relationships are established statistically from a sample of individuals representative of the species.